Stats, analysis, commentary.
Five games into a six-game Western Conference road trip, the Washington Wizards are 0-5 after their 119-109 loss to the Phoenix Suns. Those five loses are part of a 13-game losing skid that began January 3 against the New Orleans Pelicans. Washington’s last win was January 1 against the Chicago Bulls. When they played again January 10, Chicago beat them by 33.
In some ways, the final 10-point margin is deceptively close. Phoenix took the lead for good midway through the first quarter, got the lead as high as 19, and then did some classic slacking off that let the Wizards get as close as four points when Kyle Kuzma hit a three with just 1:57 left on the clock. Even then, the final outcome never felt in doubt. Washington’s closing offensive possessions had a theme:
01:15 — Poole Driving Layup – Blocked
01:08 — MISS Kuzma 27’ 3PT
00:49 — MISS Poole 8’ Driving Floating Bank Shot
00:32 — MISS Kuzma 27’ Step Back 3PT
Those final four possessions were variations on a theme. The last time a Wizards player other than Kuzma or Poole attempted to score was when Alex Sarr made a free throw with 4:12 left to play.
This is not presented as criticism of Poole and Kuzma. Both played reasonably well overall.
The Wizards stayed as close as they did largely due to ye olde three point variance. Washington entered the game as the NBA’s second worst three-point shooting team (33.0%) and hit 18-41, 43.9%. The Suns came in as the league’s fifth best three-point shooting team (37.6%) and shot just 13-40, 32.5%. That gave them a +15 advantage from three.
Phoenix won despite getting outshot because they crashed the offensive boards and got to the free throw line — +19 on free throws for the game. The free throw “disparity” isn’t a dig at the refs. The Wizards committed fouls; the Suns didn’t.
The Suns ended up winning on the offensive glass primarily due to Nick Richards grabbing six offensive boards. He added 13 defensive rebounds for a career-best 19 boards. Phoenix was 26th in offensive rebounding before last night’s game. That figures to change with the addition of Richards, who does it well.
Head coach Brian Keefe altered the starting lineup, replacing Bub Carrington with Kyshawn George. There wasn’t much discernible impact from the change.
Bright spots for the Wizards?
- Poole played a terrific game — 19 points, 4 rebounds, 10 assists, 6 steals, 1 turnover. He shot 7-16 and 5-10 from three. For the night, he had a 127 offensive rating on 24.1% usage.
- Kuzma had his best overall game in weeks, if not the season — 30 points, 11 rebounds, 4 assists, 3 turnovers. He shot 12-24, and 5-9 from three. Tap the brakes on believing anything in particular has changed. He had some clownish shot attempts, attempted risky passes that didn’t become turnovers purely due to luck, and he benefited from firing a three so badly off target that it turned into a successful bank shot. He produced an offensive rating of 106 (5.5 points per 100 possessions below average) on an astronomical 37.0% usage.
- Jonas Valanciunas had a classic “audition for a trade” game — 16 points, 4 rebounds, 2 assists on 17 minutes. He knocked down a pair of threes and was generally too much for the Suns to handle inside.
- Bilal Coulibaly didn’t have a great game, but he scored 12 points on 5-8 shooting in the second and third quarters (combined).
- Bub Carrington was okay off the bench — 11 points on 9 shots (3-8 from deep) in 26 minutes.
Other stuff?
- Phoenix’s Ryan Dunn, who recently got moved into starting lineup with Bradley Beal shifting to a bench role, sprained an ankle barely two minutes into the game and didn’t return.
- Beal played 39 minutes, scoring 20 points on 13 shots. His offensive rating: 155 on 16.0% usage.
- Beal, by the way, came into the game against Washington having one of the least efficient seasons of his career. His offensive rating was 109 — his worst mark since a 106 in 2021-22. He’s had less success getting to the rim — this season, just 16% of his field goal attempts have come in the restricted area. The only time Beal got to the rim less often was in the second year of his career when he was 20 years old and dealing with leg injuries.
- The Wizards benefited quite a bit from an uncharacteristic shooting night from Suns star Devin Booker. The Phoenix guard hit just 5-18 from the floor and missed all 8 of his three-point attempts.
Four Factors
Below are the four factors that decide wins and losses in basketball — shooting (efg), rebounding (offensive rebounds), ball handling (turnovers), fouling (free throws made).
The four factors are measured by:
- eFG% (effective field goal percentage, which accounts for the three-point shot)
- OREB% (offensive rebound percentage)
- TOV% (turnover percentage — turnovers divided by possessions)
- FTM/FGA (free throws made divided by field goal attempts)
In the table below are the four factors using the percentages and rates traditionally presented. There’s also a column showing league average in each of the categories to give a sense of each team’s performance relative to the rest of the league this season.
Stats & Metrics
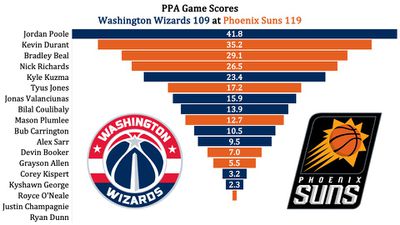
Below are a few performance metrics, including the Player Production Average (PPA) Game Score. PPA is my overall production metric, which credits players for things they do that help a team win (scoring, rebounding, playmaking, defending) and dings them for things that hurt (missed shots, turnovers, bad defense, fouls).
Game Score (GmSC) converts individual production into points on the scoreboard. The scale is the same as points and reflects each player’s total contributions for the game. The lowest possible GmSC is zero.
PPA is a per possession metric designed for larger data sets. In small sample sizes, the numbers can get weird. In PPA, 100 is average, higher is better and replacement level is 45. For a single game, replacement level isn’t much use, and I reiterate the caution about small samples sometimes producing weird results.
POSS is the number of possessions each player was on the floor in this game.
ORTG = offensive rating, which is points produced per individual possessions x 100. League average last season was 114.8. Points produced is not the same as points scored. It includes the value of assists and offensive rebounds, as well as sharing credit when receiving an assist.
USG = offensive usage rate. Average is 20%.
ORTG and USG are versions of stats created by former Wizards assistant coach Dean Oliver and modified by me. ORTG is an efficiency measure that accounts for the value of shooting, offensive rebounds, assists and turnovers. USG includes shooting from the floor and free throw line, offensive rebounds, assists and turnovers.
+PTS = “Plus Points” is a measure of the points gained or lost by each player based on their efficiency in this game compared to league average efficiency on the same number of possessions. A player with an offensive rating (points produced per possession x 100) of 100 who uses 20 possessions would produce 20 points. If the league average efficiency is 114, the league — on average — would produced 22.8 points in the same 20 possessions. So, the player in this hypothetical would have a +PTS score of -2.8.

by Kevin Broom
