Stats, commentary, analysis
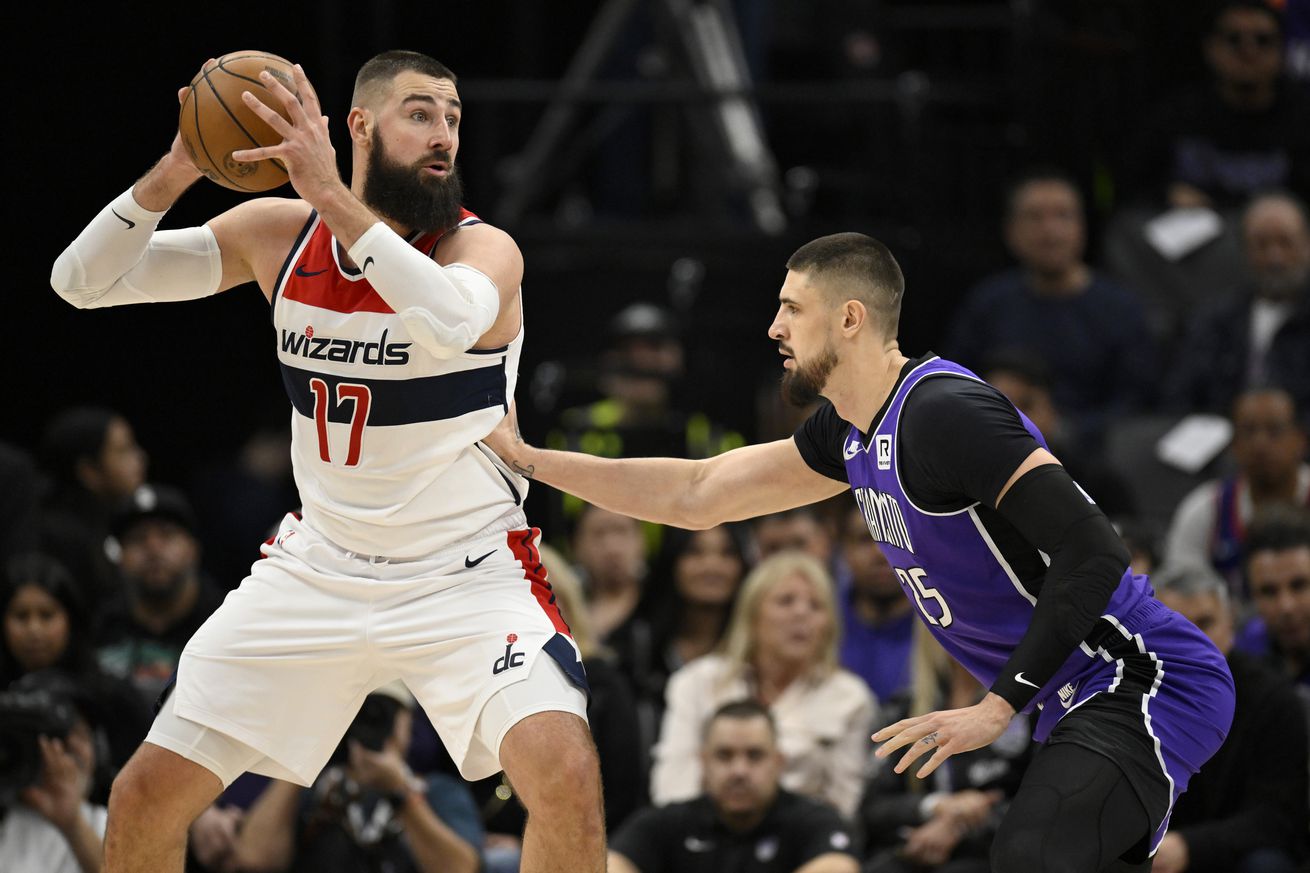
This was second night of a back-to-back on the road stuff. The Washington Wizards hung tough for maybe the first six minutes, and then the Sacramento Kings asserted themselves and cruised to a comfortable victory. The Kings led by six at the end of one, by 14 at the half, by 13 after three quarters, and by 23 at the final buzzer. The game really was never that close.
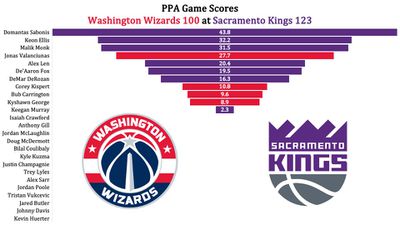
How’d things go for the Wizards? None of their starters — Jordan Poole, Bub Carrington, Bilal Coulibaly, Kyle Kuzma, and Alex Sarr — even cracked average in my PPA stat (see below). Carrington was high man among starters with an 81. In PPA, average is 100 and higher is better. The second most productive starter? Coulibaly. With a zero.
It was that kind of night.
One night after setting a franchise record for made threes, they shot 10-42 (23.8%) from deep. They also shot 46% on twos, committed 16 turnovers and could muster just 10 offensive boards despite all the bricks.
Their 41.6% effective field goal percentage was their third worst shooting night of the season. The worst was 39.2% against the Oklahoma City Thunder on Jan. 12. Number two was Dec. 3 against the Cleveland Cavaliers.
What else? Washington’s offensive efficiency was 20 points per 100 possessions below average. It was a team effort — only Jonas Valanciunas, Carrington, and Kyshawn George had above average offensive efficiency. Of course, Carrington had a 9.3% usage rate. George’s was 11.1%.
Credit for the offensive debacle should be awarded to Kyle Kuzma, Jordan Poole, and Sarr.
Kuzma posted a 74 offensive rating and 26.4% usage. His +PTS (a measure designed to compare a player’s output to league average given the same number of possessions) was -7.6. Kuzma did it by shooting 3-15 from the floor, 1-7 from three-point range, and committing four turnovers.
Poole shot 4-11 from the floor and 3-9 from deep, and committed 6 turnovers. That tallied to a 66 offensive rating on 25.0% usage, and a +PTS of -7.2
Sarr shot 1-8 from the floor and had two turnovers. His offensive rating was 58 on 21.2% usage, and a +PTS of -5.6.
Bright spots for the Wizards?
- Valanciunas had 23 points and 12 rebounds in 23 minutes. He shot 9-11 from the floor. Hopefully he can string a few more of these kinds of games together over the next couple weeks and bring the Wizards a future first round pick when they trade him.
- Carrington wasn’t good overall, but he had 6 points, 6 rebounds, and 3 assists. The rebounds were nice.
Just spots?
- Head coach Brian Keefe talked before the game about the need for players to be ready for action because the team was on the second night of a back-to-back. He told reporters it was an opportunity for those players who didn’t get minutes against the Warriors. In the first half, the “be ready” guys turned out to be Jared Butler and Justin Champagnie, both of whom had been playing well. Unfortunately, neither guy was ready, and they joined their negative production teammates.
This game was the halfway point for the Wizards. Their record is 6-35, which puts them on pace for 12 wins. That’s even worse than the 14 wins I forecasted before the season began.
Four Factors
Below are the four factors that decide wins and losses in basketball — shooting (efg), rebounding (offensive rebounds), ball handling (turnovers), fouling (free throws made).
The four factors are measured by:
- eFG% (effective field goal percentage, which accounts for the three-point shot)
- OREB% (offensive rebound percentage)
- TOV% (turnover percentage — turnovers divided by possessions)
- FTM/FGA (free throws made divided by field goal attempts)
In the table below are the four factors using the percentages and rates traditionally presented. There’s also a column showing league average in each of the categories to give a sense of each team’s performance relative to the rest of the league this season.
Stats & Metrics
Below are a few performance metrics, including the Player Production Average (PPA) Game Score. PPA is my overall production metric, which credits players for things they do that help a team win (scoring, rebounding, playmaking, defending) and dings them for things that hurt (missed shots, turnovers, bad defense, fouls).
Game Score (GmSC) converts individual production into points on the scoreboard. The scale is the same as points and reflects each player’s total contributions for the game. The lowest possible GmSC is zero.
PPA is a per possession metric designed for larger data sets. In small sample sizes, the numbers can get weird. In PPA, 100 is average, higher is better and replacement level is 45. For a single game, replacement level isn’t much use, and I reiterate the caution about small samples sometimes producing weird results.
POSS is the number of possessions each player was on the floor in this game.
ORTG = offensive rating, which is points produced per individual possessions x 100. League average last season was 114.8. Points produced is not the same as points scored. It includes the value of assists and offensive rebounds, as well as sharing credit when receiving an assist.
USG = offensive usage rate. Average is 20%.
ORTG and USG are versions of stats created by former Wizards assistant coach Dean Oliver and modified by me. ORTG is an efficiency measure that accounts for the value of shooting, offensive rebounds, assists and turnovers. USG includes shooting from the floor and free throw line, offensive rebounds, assists and turnovers.
+PTS = “Plus Points” is a measure of the points gained or lost by each player based on their efficiency in this game compared to league average efficiency on the same number of possessions. A player with an offensive rating (points produced per possession x 100) of 100 who uses 20 possessions would produce 20 points. If the league average efficiency is 114, the league — on average — would produced 22.8 points in the same 20 possessions. So, the player in this hypothetical would have a +PTS score of -2.8.
by Kevin Broom