Stats, commentary, analysis. All on the Wizards’ 16th straight loss.
The Washington Wizards’ franchise record-tying 16th consecutive loss followed a familiar pattern — a competitive first half (they dashed out to a lead that reached 21 points in the second quarter), a third-quarter collapse, and a final quarter bereft of offensive and defensive coherence.
Last night’s opponent, the Orlando Magic, were a tough, determined, physical bunch that kept grinding away until the less talented Wizards cracked. Such is life for a team built to be bad this season. When the game really matters to an opponent, they lose because the roster isn’t good enough to keep pace.
Think of it like this: if we were drafting teams from a pool comprised strictly of Wizards and Magic players, when does the first Wizards player get picked? Third? Fourth? And Orlando isn’t a particularly strong team — a bit better than average.
That said, the Wizards weren’t terrible against the Magic. Not completely, anyway. Kyle Kuzma was good, Richaun Holmes had his best game since arriving in DC, and Jordan Poole and Deni Avdija were decent.
But with Daniel Gafford traded, and Marvin Bagley III injured, the Wizards lacked size against a big, physical team. It showed throughout the night.
Musings & Observations
- The outlines of coherent, productive play from Jordan Poole are emerging. When he’s on ball, he seems to be more effective trying to create for teammates. He’s a more efficient and effective scorer in catch-and-shoot or catch-and-drive sets, or coming off screens or hand-offs. He’s still full of moves that don’t shake anyone, but there’s a template for future success.
- Johnny Davis made a couple threes, though his shot form is scary. On the catch, he’s snapping his legs together, twisting away from the basket, and loading the ball over his right shoulder. Those mechanics are unlikely to produce consistent success.
- Not an impressive outing for Bilal Coulibaly — 2-7 from the floor, 4 rebounds, 1 assist, 1 steal, 1 block in 28 minutes. His offensive efficiency was poor on just 12.6% usage.
- A rare bad game from Tyus Jones. He missed shots he’s been hitting all year, and had six assists and two turnovers.
Four Factors
Below are the four factors that decide wins and losses in basketball — shooting (efg), rebounding (offensive rebounds), ball handling (turnovers), fouling (free throws made).
Stats & Metrics
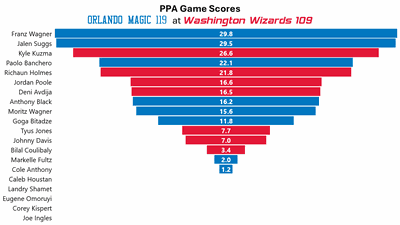
Below are a few performance metrics, including the Player Production Average (PPA) Game Score. PPA is my overall production metric, which credits players for things they do that help a team win (scoring, rebounding, playmaking, defending) and dings them for things that hurt (missed shots, turnovers, bad defense, fouls).
Game Score (GmSC) converts individual production into points on the scoreboard. The scale is the same as points and reflects each player’s total contributions for the game. The lowest possible GmSC is zero.
PPA is a per possession metric designed for larger data sets. In small sample sizes, the numbers can get weird. In PPA, 100 is average, higher is better and replacement level is 45. For a single game, replacement level isn’t much use, and I reiterate the caution about small samples sometimes producing weird results.
POSS is the number of possessions each player was on the floor in this game.
ORTG = offensive rating, which is points produced per individual possessions x 100. League average last season was 114.8. Points produced is not the same as points scored. It includes the value of assists and offensive rebounds, as well as sharing credit when receiving an assist.
USG = offensive usage rate. Average is 20%.
ORTG and USG are versions of stats created by former Wizards assistant coach Dean Oliver and modified by me. ORTG is an efficiency measure that accounts for the value of shooting, offensive rebounds, assists and turnovers. USG includes shooting from the floor and free throw line, offensive rebounds, assists and turnovers.
+PTS = “Plus Points” is a measure of the points gained or lost by each player based on their efficiency in this game compared to league average efficiency on the same number of possessions. A player with an offensive rating (points produced per possession x 100) of 100 who uses 20 possessions would produce 20 points. If the league average efficiency is 114, the league — on average — would produced 22.8 points in the same 20 possessions. So, the player in this hypothetical would have a +PTS score of -2.8.