Stats, commentary, analysis.
Garbage time started early in Dallas as the Mavericks rode seven threes from Klay Thompson to a 26-point lead at the end of the first period. In other news, Klay Thompson is still playing in the NBA.
The final margin (Wizards lost by 22) does not accurately convey the wreckage. The Wizards never led or even tied the game after 0-0. The Mavericks led by as much as 38…in the first half. And the longest run from either team was 10-0.
The annihilation was followed by the slacking off, as what was left of the Mavericks roster coasted in with a comfortable victory. To make the game even more embarrassing for the Wizards, Dallas had six players out with injury or illness, including Luka Doncic and Dereck Lively II.
Adding injury to insult, 19-year-old rookie Alex Sarr left the game with a sprained ankle in the first half and didn’t return. No word yet on whether he’ll miss upcoming games.
Bright spots?
- On Playback, Greg Finberg and I had lots of time to eviscerate Kyle Kuzma’s comments after the team’s loss to the Los Angeles Clippers, and to dissect what’s wrong with the team’s media relations “strategy.”
Hmm, let’s focus back on…
Bright spots for the Wizards?
- Bilal Coulibaly played decent in the blowout — 16 points, 4 rebounds, 5 assists, 2 steals, 2 blocks, just 1 turnover. It wasn’t great (just 6-15 from the floor and 2-6 from three), but a) he tied for the team lead in field goal attempts, tied for the team lead in possessions used, and c) had a 113 offensive rating on 23.8% usage. That’s basically league average efficiency on slightly above average usage, which is good for Coulibaly.
- Jordan Poole had an off game and still was kinda okay — 15 points, 6 rebounds, 6 assists and 2 turnovers. His offensive rating was a subpar 109, but that’s not bad terrible for a relatively bad game from him.
- The Garbage Time Gang posted nice-looking numbers. I normally remove late-game minutes in a blowout from individual PPA game score calculations because they’re meaningless, but when your down 21 seven minutes into the game, it’s kinda all garbage time from there.
- A Richaun Holmes free throw with 46 seconds remaining in the third quarter gave the Wizards 73 points — an exact match with Dallas’ total at halftime. The “go-ahead” came when Poole hit a pull-up three from 32 feet with two seconds left in the third quarter to give the Wizards 76 points.
Other stuff?
- The Wizards held Thompson without a three after his franchise record setting first quarter.
- Former Wizards center Daniel Gafford had 18 points, 8 rebounds (6 on the offensive end), and 5 blocks in 24 minutes.
- We all got to learn about the existence of Kylor Kelley, who grabbed four rebounds in 8 minutes for Dallas, and nearly had a poster dunk.
Four Factors
Below are the four factors that decide wins and losses in basketball — shooting (efg), rebounding (offensive rebounds), ball handling (turnovers), fouling (free throws made).
The four factors are measured by:
- eFG% (effective field goal percentage, which accounts for the three-point shot)
- OREB% (offensive rebound percentage)
- TOV% (turnover percentage — turnovers divided by possessions)
- FTM/FGA (free throws made divided by field goal attempts)
In the table below are the four factors using the percentages and rates traditionally presented. There’s also a column showing league average in each of the categories to give a sense of each team’s performance relative to the rest of the league this season.
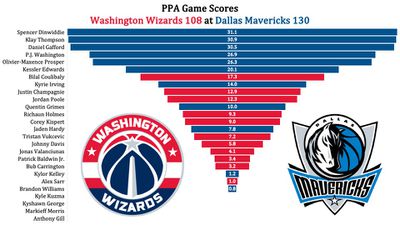
Stats & Metrics
Below are a few performance metrics, including the Player Production Average (PPA) Game Score. PPA is my overall production metric, which credits players for things they do that help a team win (scoring, rebounding, playmaking, defending) and dings them for things that hurt (missed shots, turnovers, bad defense, fouls).
Game Score (GmSC) converts individual production into points on the scoreboard. The scale is the same as points and reflects each player’s total contributions for the game. The lowest possible GmSC is zero.
PPA is a per possession metric designed for larger data sets. In small sample sizes, the numbers can get weird. In PPA, 100 is average, higher is better and replacement level is 45. For a single game, replacement level isn’t much use, and I reiterate the caution about small samples sometimes producing weird results.
POSS is the number of possessions each player was on the floor in this game.
ORTG = offensive rating, which is points produced per individual possessions x 100. League average last season was 114.8. Points produced is not the same as points scored. It includes the value of assists and offensive rebounds, as well as sharing credit when receiving an assist.
USG = offensive usage rate. Average is 20%.
ORTG and USG are versions of stats created by former Wizards assistant coach Dean Oliver and modified by me. ORTG is an efficiency measure that accounts for the value of shooting, offensive rebounds, assists and turnovers. USG includes shooting from the floor and free throw line, offensive rebounds, assists and turnovers.
+PTS = “Plus Points” is a measure of the points gained or lost by each player based on their efficiency in this game compared to league average efficiency on the same number of possessions. A player with an offensive rating (points produced per possession x 100) of 100 who uses 20 possessions would produce 20 points. If the league average efficiency is 114, the league — on average — would produced 22.8 points in the same 20 possessions. So, the player in this hypothetical would have a +PTS score of -2.8.
by Kevin Broom