Stats, analysis, commentary.
The Washington Wizards shrugged off the injury/illness related absences of Deni Avdija, Kyle Kuzma, Tyus Jones, and Bilal Coulibaly and beat the Chicago Bulls for their third straight victory. It’s the team’s first three-game winning streak since January 2023.
This matchup with the Bulls was entertaining in its way. That is to say, if you’re entertained by seeing the flowing offenses that are proficient at making the ball go through the hoop, this one wasn’t for you. If you find entertainment in seeing tight competition between flawed players trying their best, this one was a delight.
If you give me a choice, I’ll take “beautiful game” most of the time. But I still love a hard fought game between guys working to overcome weaknesses and scrapping for a win.
This game defies easy explanations. The Wizards definitely owe a lot of this win to stellar play in the middle. Richaun Holmes and Marvin Bagley III combined for 30 points on 18 shots, plus 17 rebounds, two assists, a steal and a block. Holmes had seven offensive rebounds, and a 14-9 offensive rebounding advantage was critical in a game this close.
But the Bulls centers were terrific too. Andre Drummond came off the bench to post a double-double in his first 12 minutes of action. He finished with 10 points, 12 rebounds and two blocks in 19 minutes. Nikola Vucevic got just five field goal attempts (and still scored nine points), but contributed with 16 rebounds, three assists, and three blocks. The Bulls bigs combined for 19 points, 28 rebounds, four assists, and five blocks.
The Wizards slightly outshot the Bulls (47.4% efg to 47.1%), and if you watched without looking at the numbers, you might conclude Chicago lost because of an inability to hit open threes. There’s some truth to that, except…well…the Wizards couldn’t make open threes either. The Bulls shot 10-35, 28.6% from three. The Wizards shot 14-49 for an identical 28.6%.
Altogether, the teams combined for 40.8% shooting from the floor and 28.6% from three-point range, which rolls together into a 47.3% effective field goal percentage.
Neither team could be convicted if someone accused them of defending well, though it’s fair to say both teams gave it a legitimate effort.
The Bulls were probably hurt more by some strange officiating — players were literally being knocked to the floor in violent collisions on one end only to have a touch foul called on the other — but they also were +10 in free throw attempts, and +8 in made free throws.
Musings & Observations
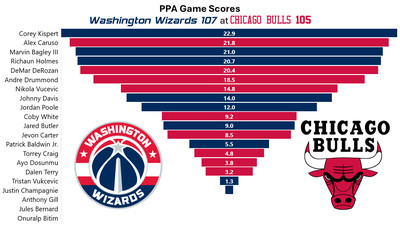
- Corey Kispert had an atrocious shooting night — 6-18 from the floor and 3-10 from deep (a 41.7% efg) and he had two turnovers, but he also had a career high 12 rebounds, plus three assists, and two steals.
- Johnny Davis had his best game of the season — eight points on 3-6 shooting, 2-4 from three-point range, plus two rebounds and three assists. He gave a good defensive effort, once again. Now, is that repeatable? I’d lean towards “not” because the shooting form is hinkty (his two misses were really ugly), and he looks slow out there most of the time. But, he’s on the big and strong side for a guard, and he seems to be figuring out how to use those attributes on defense.
- Jordan Poole was okay. At times. He did his usual mixtape dance and dribble stuff that resulted with stalwart defenders like Vucevic still unshook. His shot selection induces nausea. His decision-making is apparently intended to push him well past the point where his skill could make him successful and straight into the realm of “test your luck,” and sometimes his luck pays off. By NBA standards, his efficiency (109 offensive rating, 50.0% efg) was subpar. In this game, it was a net positive for the Wizards.
- The Bulls broadcast raved about Jared Butler, who did finish the game with 13 assists — some of which came on some nice passes. He also shot 3-12 from the floor, 0-6 from three, and had four turnovers.
- Tristan Vukcevic launched five shots in nine minutes in his second NBA game, including 2-4 from three-point range.
- Alex Caruso is an excellent defender. He routinely started possessions in one corner and through switches and good ol’ fashioned hustle finished them out top or in the opposite corner where he affected Wizards shots.
Four Factors
Below are the four factors that decide wins and losses in basketball — shooting (efg), rebounding (offensive rebounds), ball handling (turnovers), fouling (free throws made).
Stats & Metrics
Below are a few performance metrics, including the Player Production Average (PPA) Game Score. PPA is my overall production metric, which credits players for things they do that help a team win (scoring, rebounding, playmaking, defending) and dings them for things that hurt (missed shots, turnovers, bad defense, fouls).
Game Score (GmSC) converts individual production into points on the scoreboard. The scale is the same as points and reflects each player’s total contributions for the game. The lowest possible GmSC is zero.
PPA is a per possession metric designed for larger data sets. In small sample sizes, the numbers can get weird. In PPA, 100 is average, higher is better and replacement level is 45. For a single game, replacement level isn’t much use, and I reiterate the caution about small samples sometimes producing weird results.
POSS is the number of possessions each player was on the floor in this game.
ORTG = offensive rating, which is points produced per individual possessions x 100. League average last season was 114.8. Points produced is not the same as points scored. It includes the value of assists and offensive rebounds, as well as sharing credit when receiving an assist.
USG = offensive usage rate. Average is 20%.
ORTG and USG are versions of stats created by former Wizards assistant coach Dean Oliver and modified by me. ORTG is an efficiency measure that accounts for the value of shooting, offensive rebounds, assists and turnovers. USG includes shooting from the floor and free throw line, offensive rebounds, assists and turnovers.
+PTS = “Plus Points” is a measure of the points gained or lost by each player based on their efficiency in this game compared to league average efficiency on the same number of possessions. A player with an offensive rating (points produced per possession x 100) of 100 who uses 20 possessions would produce 20 points. If the league average efficiency is 114, the league — on average — would produced 22.8 points in the same 20 possessions. So, the player in this hypothetical would have a +PTS score of -2.8.