Stats, analysis, commentary.
The Washington Wizards head into the All-Star break with another feisty, competitive loss in the books, this time to the New Orleans Pelicans. Washington fell behind by as much as 20 points in the first half, and looked like they were already headed to vacation. But they trimmed the lead to just eight by halftime, and then — carried by the power drives from Deni Avidja — took a six-point lead in the third.
As is often the case for a team with as many roster holes as the Wizards have, they ran out of gas in the fourth and ultimately lost by seven.
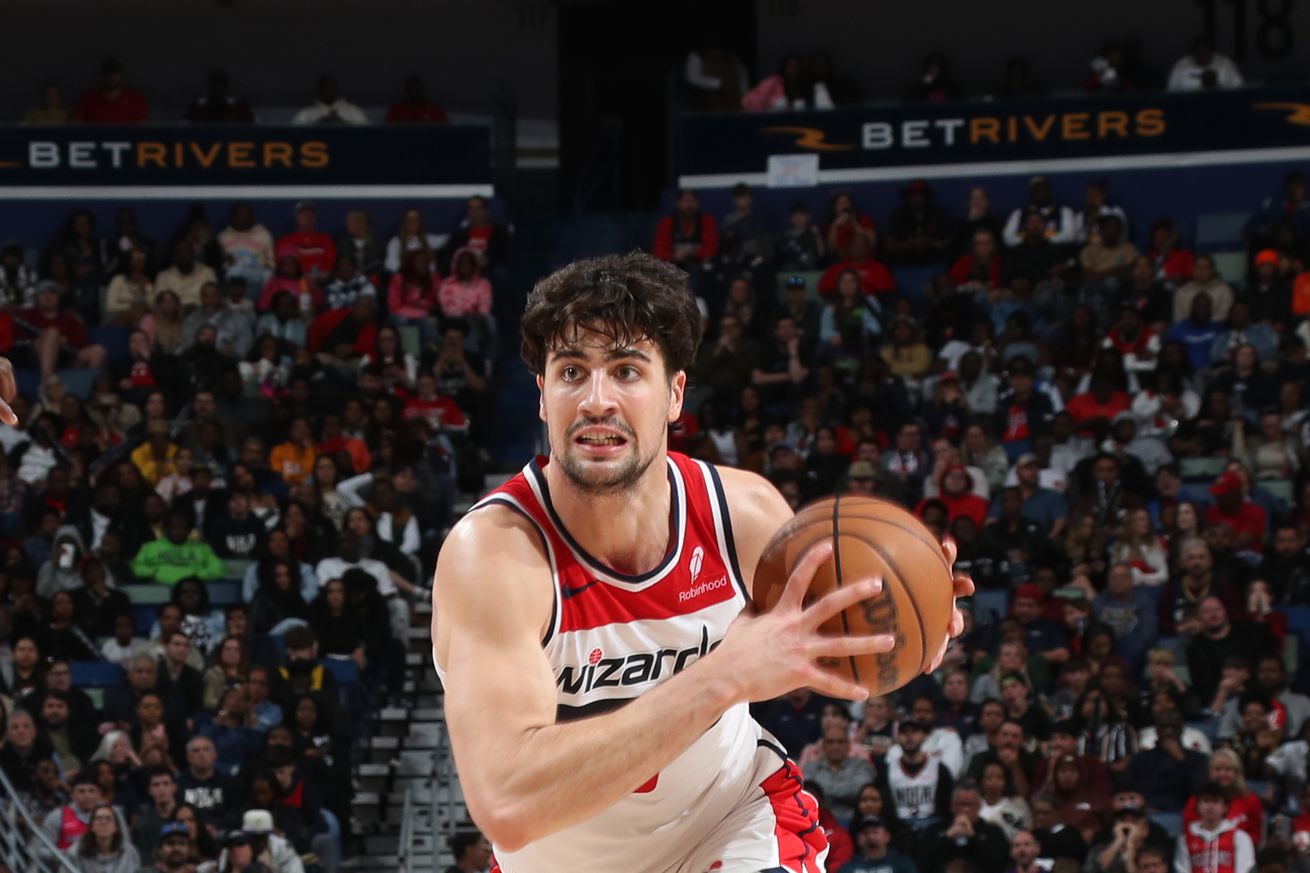
The story of this one was Avdija. One game after setting a career high of 25 points, he poured in 43 on New Orleans with an array of powerful drives to the basket and some knockdown shooting from three-point range. The Pelicans struggled to keep him out of the lane and fouled him repeatedly when he got there.
The fourth quarter wasn’t as kind to Avdija. The Pelicans finally took Zion Williamson off Avdija and used Naji Marshall — a strong 6-6 forward — to defend Avdija. Marshall worked to cut off Avdija’s drives to his right hand, and his defensive work helped slow Washington’s 6-9 forward.
Still, this was a whale of a game from Avdija — the kind of performance that could make him part of the team’s long-term rebuild. The work he’s put into his body and game is paying off. Williamson, who drew first matchup against Avdija, didn’t give sufficient effort to limit him. The Pelicans’ arsenal of lanky wing defenders weren’t strong enough to contain him. The only player who seemed to have any success was Marshall.
Avdija finished the game with an excellent 144 offensive rating (points produced per possession x 100) on 31.7% usage.
In Kyle Kuzma’s absence due to a non-COVID illness, Avdija’s teammates were a mix of decent and putrid.
Tyus Jones was a hyper-efficient playmaker (again) — 14 points on 5-7 shooting, 15 assists, 2 turnovers.
Corey Kispert made some shots (5-10 from deep) and had 4 rebounds and 6 assists.
Jordan Poole had one of his better games of the season, which is to say he looked like a competent professional basketball player most of the night. He finished with 19 points on 7-15 shooting (5-10 from three), 5 rebounds, 6 assists, and 3 steals. The drags on his production: five fouls and a whopping four turnovers, including an egregious carry on the possession that represented what was likely Washington’s last hope of winning.
Marvin Bagley III grabbed six offensive rebounds, though he had trouble converting inside against New Orleans’ size (6-14 from the floor), and his defensive effectiveness was poor.
On the putrid end of the scale were Bilal Coulibaly and Landry Shamet. Coulibaly scored 6 points on 6 shots, and committed 4 turnovers and 5 fouls. Rough night. Shamet shot 2-8 from the floor (0-4 from three), committed a couple turnovers, and got into a scuffle with Larry Nance Jr.
Four Factors
Below are the four factors that decide wins and losses in basketball — shooting (efg), rebounding (offensive rebounds), ball handling (turnovers), fouling (free throws made).
Stats & Metrics
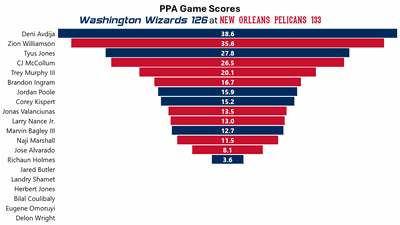
Below are a few performance metrics, including the Player Production Average (PPA) Game Score. PPA is my overall production metric, which credits players for things they do that help a team win (scoring, rebounding, playmaking, defending) and dings them for things that hurt (missed shots, turnovers, bad defense, fouls).
Game Score (GmSC) converts individual production into points on the scoreboard. The scale is the same as points and reflects each player’s total contributions for the game. The lowest possible GmSC is zero.
PPA is a per possession metric designed for larger data sets. In small sample sizes, the numbers can get weird. In PPA, 100 is average, higher is better and replacement level is 45. For a single game, replacement level isn’t much use, and I reiterate the caution about small samples sometimes producing weird results.
POSS is the number of possessions each player was on the floor in this game.
ORTG = offensive rating, which is points produced per individual possessions x 100. League average last season was 114.8. Points produced is not the same as points scored. It includes the value of assists and offensive rebounds, as well as sharing credit when receiving an assist.
USG = offensive usage rate. Average is 20%.
ORTG and USG are versions of stats created by former Wizards assistant coach Dean Oliver and modified by me. ORTG is an efficiency measure that accounts for the value of shooting, offensive rebounds, assists and turnovers. USG includes shooting from the floor and free throw line, offensive rebounds, assists and turnovers.
+PTS = “Plus Points” is a measure of the points gained or lost by each player based on their efficiency in this game compared to league average efficiency on the same number of possessions. A player with an offensive rating (points produced per possession x 100) of 100 who uses 20 possessions would produce 20 points. If the league average efficiency is 114, the league — on average — would produced 22.8 points in the same 20 possessions. So, the player in this hypothetical would have a +PTS score of -2.8.