Stats, analysis, commentary
The Wizards got thumped by the Miami Heat, and it’s fine. The Heat are the better team this season, which a) we’ve known since the rosters took shape in the offseason, and b) is a true statement for arguably every team in the NBA.
In my house, we were a bit behind the action most of the way, and Washington made one of those phony fourth quarter runs that made my son’s “Wizards won?!” fake spoiler plausible for a minute or two.
In truth, the Heat played a sloppy, ragged game that would have resulted in defeat to most NBA teams on most nights. Against a bad Wizards team missing two veteran starters (Kyle Kuzma (tired of getting stomped heel) and Tyus Jones (back)), it was more than enough.
More specific? Miami shot better (58.0% to 51.7% effective field goal percentage), committed fewer turnovers (15-13), and were +9 in made free throws. The game wasn’t close, and my son’s fake spoiler notwithstanding, the result was never in doubt. The Heat are better.
Such is life for a tanking team.
Musings and Observations
- Anthony Gill scored 18 points on 12 shots in just 20 minutes of action. He tied his career high in points, which he previously set against the Chicago Bulls on January 11, 2023.
- Tristan Vukcevic didn’t accomplish much in his 13 minutes of action — aside from successfully encouraging the refs to erroneously give the Wizards the ball when it was Vukcevic who slapped it out — but he should get 24 minutes per night the rest of the way.
- Jared Butler had a wild game with a lot of good stuff, including diving on the floor for a loose ball (demonstrating that a small Wizards guard is permitted to hustle). He shot 5-6 from the floor, including 2-3 from deep — an effective field goal percentage of 100%. He also had seven assists…and three turnovers and three fouls.
- If you want to believe Jordan Poole played well, focus on 22 points, 4 rebounds, 8 assists and a steal. Ignore the 8-20 shooting (4-12 from three), four turnovers and three fouls. Also ignore the standing around on defense that conceded multiple open shots to the Heat, and even how his idea of showing defensive effort was to grab opponents and foul them. The team was -23 in his minutes.
- Deni Avdija didn’t have a stellar offensive night (offensive rating (points produced per possession x 100) of just 104, but he crashed the boards and gave his usual strong defensive effort.
- Johnny Davis grabbed five rebounds in 19 minutes.
- Former Wizards Thomas Bryant and Delon Wright got some playing time against Washington. Bryant threw down a nice alley-oop dunk and was otherwise not much good. Wright had about as good a game as a player with 10% usage can have. He finished the night with 9 points on 2 field goal attempts, plus 4 assists, 4 steals, and a block.
- Listened to while I wrote: It’s Allright With Me performed by the incomparable Oscar Peterson.
Four Factors
Below are the four factors that decide wins and losses in basketball — shooting (efg), rebounding (offensive rebounds), ball handling (turnovers), fouling (free throws made).
Stats & Metrics
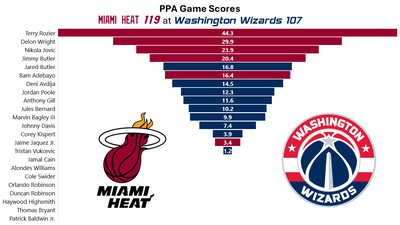
Below are a few performance metrics, including the Player Production Average (PPA) Game Score. PPA is my overall production metric, which credits players for things they do that help a team win (scoring, rebounding, playmaking, defending) and dings them for things that hurt (missed shots, turnovers, bad defense, fouls).
Game Score (GmSC) converts individual production into points on the scoreboard. The scale is the same as points and reflects each player’s total contributions for the game. The lowest possible GmSC is zero.
PPA is a per possession metric designed for larger data sets. In small sample sizes, the numbers can get weird. In PPA, 100 is average, higher is better and replacement level is 45. For a single game, replacement level isn’t much use, and I reiterate the caution about small samples sometimes producing weird results.
POSS is the number of possessions each player was on the floor in this game.
ORTG = offensive rating, which is points produced per individual possessions x 100. League average last season was 114.8. Points produced is not the same as points scored. It includes the value of assists and offensive rebounds, as well as sharing credit when receiving an assist.
USG = offensive usage rate. Average is 20%.
ORTG and USG are versions of stats created by former Wizards assistant coach Dean Oliver and modified by me. ORTG is an efficiency measure that accounts for the value of shooting, offensive rebounds, assists and turnovers. USG includes shooting from the floor and free throw line, offensive rebounds, assists and turnovers.
+PTS = “Plus Points” is a measure of the points gained or lost by each player based on their efficiency in this game compared to league average efficiency on the same number of possessions. A player with an offensive rating (points produced per possession x 100) of 100 who uses 20 possessions would produce 20 points. If the league average efficiency is 114, the league — on average — would produced 22.8 points in the same 20 possessions. So, the player in this hypothetical would have a +PTS score of -2.8.