Stats, analysis, commentary.
The Washington Wizards led by 11 with 10:08 to play and got outscored 30-11 the rest of the way to lose to the Dallas Mavericks by eight, 112-104.
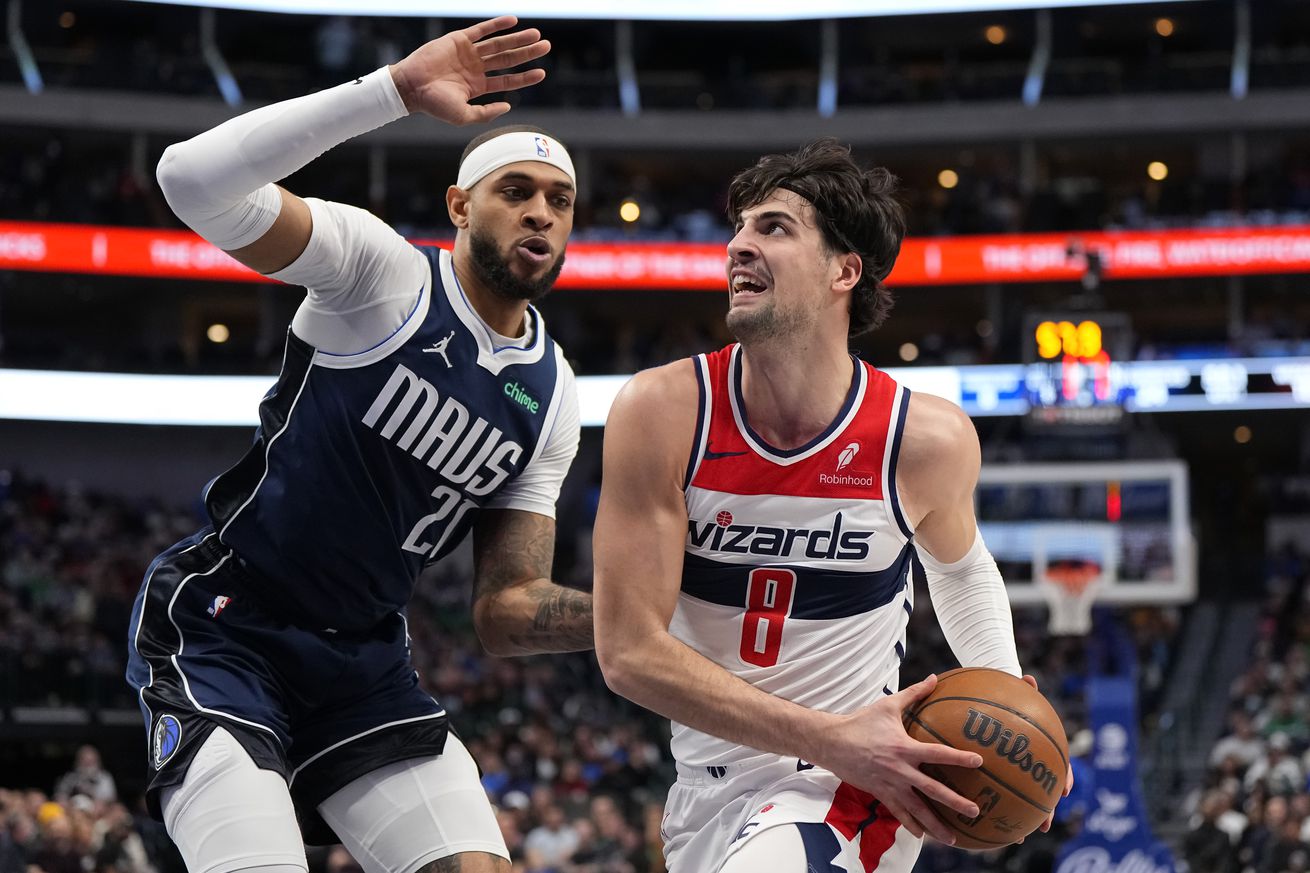
It was an ugly game replete with bricks (a combined 23.5% from three-point range), turnovers (16 for Dallas, 15 for the Wizards), and even a bloody foul (Corey Kispert elbowed Luka Doncic in the chin).
In a league averaging 116.0 points per 100 possessions, the Wizards and Mavericks together produced an offensive rating of just 96.
If you didn’t watch, you might be tempted to think it was a game characterized by stellar defense. If you did watch, you probably thought the bad offense was just that — bad offense.
The teams entered the game ranked 27th and 22nd in defense this season. Last night, there were some good defensive plays, of course, but…for example…by my count, the Mavericks shot 6-26 (23.1%) on open threes.
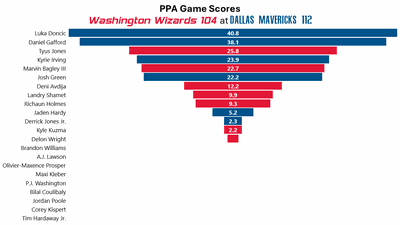
That’s not to say there wasn’t effort. Both teams played hard, and the game was competitive. Execution was another matter. The Wizards’ doubled Doncic most of the game to force the ball out of his hands. A fine plan, but Doncic still finished with 26 points, 11 rebounds, and 15 assists. Despite five turnovers, his offensive rating was 118. Overall, a bit subpar by his standards, but a terrific game for mere NBA mortals.
Former Wizards center Daniel Gafford got a rare chance to experience victory in a game involving the Wizards. He dominated inside against his replacements, Marvin Bagley III and Richaun Holmes, with 16 points, 17 rebounds (tied for his career high) and 5 blocked shots.
The Wizards wrap their pre-All-Star break schedule with a highly likely loss to the New Orleans Pelicans on Wednesday.
This & That
- Deni Avdija drove repeatedly and kept finding ways to get to his right hand and finish inside. His shooting efficiency was excellent — 11-17 from the floor — and he got six free throw attempts (he made just two). He has to figure out how to reduce the turnovers. He had five against the Mavericks, which dragged his offensive rating (points produced per possession x 100) to 100. Which is 16 points per 100 possessions below league average.
- Tyus Jones notched a career-high 16 assists to just 2 turnovers.
- Bagley got outplayed by Gafford, though his overall production was still pretty good — 12 points, 13 rebounds in 28 minutes.
- Richaun Holmes, acquired in the Gafford trade, was fine in limited minutes during his Wizards debut. That said, I saw nothing to make me think his 13 minutes wouldn’t have been better spent playing someone else.
- Kyle Kuzma had 23 points and 8 rebounds, but in truth, it was a crummy game. His shooting was subpar (9-19 from the floor, 1-7 from deep), zero assists, 4 turnovers, 4 fouls. His offensive rating was 88 on a team-high 27.7% usage rate.
- Bilal Coulibaly made a couple defensive plays and grabbed 7 rebounds…and shot 1-10 from the floor.
- Jordan Poole had another astonishingly bad game — 1-12 from the floor, 1-6 from three, no free throws. He did contribute 6 rebounds, 3 assists, 3 steals and a block, but it’s virtually impossible to be a positive contributor shooting that poorly.
- Corey Kispert shot 2-11 from the floor and 1-7 from three.
- All together, Coulibaly, Poole and Kispert shot 4-33 from the floor (12.1%), 3-17 (17.6%) from three, and committed three turnovers. That’s a combined offensive rating of 49. Ouch.
Four Factors
Below are the four factors that decide wins and losses in basketball — shooting (efg), rebounding (offensive rebounds), ball handling (turnovers), fouling (free throws made).
Stats & Metrics
Below are a few performance metrics, including the Player Production Average (PPA) Game Score. PPA is my overall production metric, which credits players for things they do that help a team win (scoring, rebounding, playmaking, defending) and dings them for things that hurt (missed shots, turnovers, bad defense, fouls).
Game Score (GmSC) converts individual production into points on the scoreboard. The scale is the same as points and reflects each player’s total contributions for the game. The lowest possible GmSC is zero.
PPA is a per possession metric designed for larger data sets. In small sample sizes, the numbers can get weird. In PPA, 100 is average, higher is better and replacement level is 45. For a single game, replacement level isn’t much use, and I reiterate the caution about small samples sometimes producing weird results.
POSS is the number of possessions each player was on the floor in this game.
ORTG = offensive rating, which is points produced per individual possessions x 100. League average last season was 114.8. Points produced is not the same as points scored. It includes the value of assists and offensive rebounds, as well as sharing credit when receiving an assist.
USG = offensive usage rate. Average is 20%.
ORTG and USG are versions of stats created by former Wizards assistant coach Dean Oliver and modified by me. ORTG is an efficiency measure that accounts for the value of shooting, offensive rebounds, assists and turnovers. USG includes shooting from the floor and free throw line, offensive rebounds, assists and turnovers.
+PTS = “Plus Points” is a measure of the points gained or lost by each player based on their efficiency in this game compared to league average efficiency on the same number of possessions. A player with an offensive rating (points produced per possession x 100) of 100 who uses 20 possessions would produce 20 points. If the league average efficiency is 114, the league — on average — would produced 22.8 points in the same 20 possessions. So, the player in this hypothetical would have a +PTS score of -2.8.