Stats, analysis, commentary.
I came into the Wizards vs. Bulls game with a sore neck and a headache, and I emerged with a serious case of eyesore. Watching the game was a stultifying chore made marginally better by the little things like Benny the Bull hitting a no-look half court shot during a timeout.
Seriously, top highlights of the evening were the National Anthem performed on uilleann pipes, and the halftime Irish dance show.
They did play a basketball game, which the Wizards lost. By 28 points. It wasn’t that close a contest. Truth is, the Bulls didn’t even play all that well. They bungled about enough in the second half that head coach Billy Donovan didn’t feel comfortable pulling the starters and letting the scrubs mop up.
Missing Tyus Jones (back), the Wizards were unable to get into basic half court sets, and couldn’t get good shots with any regularity (or convert the ones they got). Missing Deni Avdija (knee), the Wizards were feeble on defense and slow to get into transition. Missing Marvin Bagley III (back), the Wizards were overwhelmed inside by Nikola Vucevic and Andre Drummond, got outrebounded 51-32, and were outscored in the paint, 68-46.
For the Wizards, Corey Kispert had a good game. He shot well (62.5% effective field goal percentage) and somehow had 3 blocks and 3 steals.
Justin Champagnie was okay, though he had several sloppy passes that resulted in turnovers or made possessions more difficult than necessary. He gave a reasonably good effort on defense.
Bilal Coulibaly was okay — 15 points on 5-9 shooting, 8 rebounds, 2 assists and a steal. He also had a couple turnovers and a few awkward misses on drives.
Starting in place of Tyus Jones (his first start in 12 games), Jordan Poole mostly stunk. He scored 13 points on 4-12 shooting, though three of those makes came in the fourth quarter when the game was long out of reach. He had some good passes, though he also committed four turnovers and got a tech for cussing out a ref. For the game, a 93 offensive rating (points produced per possession x 100) on 35.2% usage.
Kyle Kuzma stunk too — 11 points, 5 rebounds, 4 assists and 3 turnovers. It was a low-energy, lackluster performance from the team’s leader.
I could keep going, but there’s not much point. No one played well except for Kispert and maybe Champagnie. Eugene Omoruyi was bad but at least managed to annoy Vucevic enough to draw a tech.
The game couldn’t end soon enough. Same for the 2023-24 season.
Four Factors
Below are the four factors that decide wins and losses in basketball — shooting (efg), rebounding (offensive rebounds), ball handling (turnovers), fouling (free throws made).
Stats & Metrics
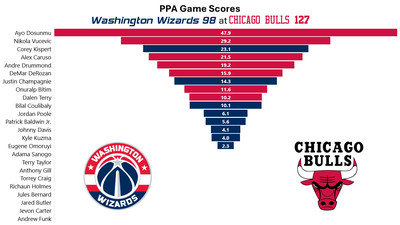
Below are a few performance metrics, including the Player Production Average (PPA) Game Score. PPA is my overall production metric, which credits players for things they do that help a team win (scoring, rebounding, playmaking, defending) and dings them for things that hurt (missed shots, turnovers, bad defense, fouls).
Game Score (GmSC) converts individual production into points on the scoreboard. The scale is the same as points and reflects each player’s total contributions for the game. The lowest possible GmSC is zero.
PPA is a per possession metric designed for larger data sets. In small sample sizes, the numbers can get weird. In PPA, 100 is average, higher is better and replacement level is 45. For a single game, replacement level isn’t much use, and I reiterate the caution about small samples sometimes producing weird results.
POSS is the number of possessions each player was on the floor in this game.
ORTG = offensive rating, which is points produced per individual possessions x 100. League average last season was 114.8. Points produced is not the same as points scored. It includes the value of assists and offensive rebounds, as well as sharing credit when receiving an assist.
USG = offensive usage rate. Average is 20%.
ORTG and USG are versions of stats created by former Wizards assistant coach Dean Oliver and modified by me. ORTG is an efficiency measure that accounts for the value of shooting, offensive rebounds, assists and turnovers. USG includes shooting from the floor and free throw line, offensive rebounds, assists and turnovers.
+PTS = “Plus Points” is a measure of the points gained or lost by each player based on their efficiency in this game compared to league average efficiency on the same number of possessions. A player with an offensive rating (points produced per possession x 100) of 100 who uses 20 possessions would produce 20 points. If the league average efficiency is 114, the league — on average — would produced 22.8 points in the same 20 possessions. So, the player in this hypothetical would have a +PTS score of -2.8.