Stats, analysis, commentary.
The only real question at opening tip of the the Boston Celtics at Washington Wizards St. Patrick’s Day game was the final margin of Boston’s victory.
The Wizards are arguably the NBA’s weakest team this season, and they were missing Kyle Kuzma (shoulder), Deni Avdija (knee), Tyus Jones (back), Bilal Coulibaly (wrist), Marvin Bagley III (back), Landry Shamet (calf), and Isaiah Livers (hip).
Sharp-eyed readers may have picked up that Washington’s injured list includes its entire starting five. Eugene Omoruyi sprained an ankle during the game.
Boston was missing key players, as well, including Jaylen Brown (ankle), Derrick White (hand), and Kristaps Porzingis (hamstring). That’s three starters, any of which would be the best player on the Wizards.
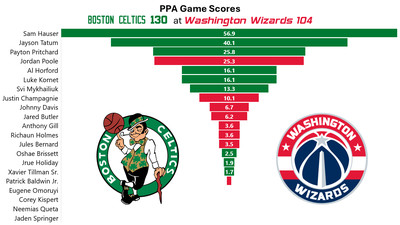
In the absence of what felt like everyone, Jordan Poole played well — an efficient 31 points and 4 assists in just 23 minutes of action. He did get stymied a couple times by Sam Hauser, but he looked a lot like the Golden State Poole — jittery, slippery, getting and making good shots. This is a version of Poole the Wizards hoped to get when they traded for him.
Truth be told, the rest of the game isn’t worth close scrutiny or in depth analysis. The non-Poole Wizards were all different flavors of bad. The only guy for whom that could be categorized as “disappointing” was Corey Kispert, and even then Kispert’s overall production tracks pretty closely to his three-point percentage…and he hit just 1-5 against Boston.
Some of the younger guys had positive moments. Justin Champagnie hit a couple threes and grabbed eight rebounds. Johnny Davis cracked 50% from the floor (4-7) and had a couple blocks. Jared Butler produced six assists. Patrick Baldwin Jr. had a steal and a couple blocks.
They tried but were vastly outmatched by Jayson Tatum and Boston backups.
Of note: Boston’s Hauser hit 10 threes in 23 minutes before stepping on the foot of a Wizards player sitting on the bench and spraining his ankle. He finished one three from the franchise record for makes in a single game, and was the first player in league history to hit 10+ threes in just 23 minutes of action.
Next up for the Wizards: a home game Tuesday night against the Houston Rockets.
Four Factors
Below are the four factors that decide wins and losses in basketball — shooting (efg), rebounding (offensive rebounds), ball handling (turnovers), fouling (free throws made).
Stats & Metrics
Below are a few performance metrics, including the Player Production Average (PPA) Game Score. PPA is my overall production metric, which credits players for things they do that help a team win (scoring, rebounding, playmaking, defending) and dings them for things that hurt (missed shots, turnovers, bad defense, fouls).
Game Score (GmSC) converts individual production into points on the scoreboard. The scale is the same as points and reflects each player’s total contributions for the game. The lowest possible GmSC is zero.
PPA is a per possession metric designed for larger data sets. In small sample sizes, the numbers can get weird. In PPA, 100 is average, higher is better and replacement level is 45. For a single game, replacement level isn’t much use, and I reiterate the caution about small samples sometimes producing weird results.
POSS is the number of possessions each player was on the floor in this game.
ORTG = offensive rating, which is points produced per individual possessions x 100. League average last season was 114.8. Points produced is not the same as points scored. It includes the value of assists and offensive rebounds, as well as sharing credit when receiving an assist.
USG = offensive usage rate. Average is 20%.
ORTG and USG are versions of stats created by former Wizards assistant coach Dean Oliver and modified by me. ORTG is an efficiency measure that accounts for the value of shooting, offensive rebounds, assists and turnovers. USG includes shooting from the floor and free throw line, offensive rebounds, assists and turnovers.
+PTS = “Plus Points” is a measure of the points gained or lost by each player based on their efficiency in this game compared to league average efficiency on the same number of possessions. A player with an offensive rating (points produced per possession x 100) of 100 who uses 20 possessions would produce 20 points. If the league average efficiency is 114, the league — on average — would produced 22.8 points in the same 20 possessions. So, the player in this hypothetical would have a +PTS score of -2.8.