Stats, analysis, commentary.
Both the Wizards and the Portland Trail Blazers were missing a bunch of guys due to injury. Get them all back to full health and play this one again, and the result is probably about the same.
If there’s a bright side to players being injured it’s the opportunity to give 31 valuable developmental minutes to 31-year old Anthony Gill.
Wait, you’re saying Gill is not a centerpiece of the team’s long-term plan?
I (sorta) kid. Truth is, Patrick Baldwin Jr. and Justin Champagnie aren’t front and center in the long-term plan either. Nor should they be. And they did start Tristan Vukcevic in the middle, and surely would have played him more but for the rampant fouling (five fouls in 24 minutes).
In other words, the Wizards have a lot to do in this rebuild.
As for the game, the Trail Blazers won because Washington couldn’t shoot straight or rebound. It’s fair to say Portland couldn’t shoot straight either (just a 48.4% effective field goal percentage), but the Wizards were less straight (if that’s a thing).
Two key stats determined the outcome:
- The Wizards shot 5-33 (15.2%) from three-point range.
- The Trail Blazers grabbed 16 offensive rebounds to Washington’s 12.
Musings & Observations
- Very good game from Deni Avdija, who had 22 points on 12 field goal attempts, got to the free throw line eight times (he made all eight), and grabbed 12 rebounds. He got scored on a bit but made Trail Blazers take tough shots, and he got a steal and two blocks. No assists was a bit surprising, but he kept the turnovers down. His overall offensive rating (points produced per possession x 100) was an excellent 126.
- One good thing about Tristan Vukcevic is he tries to make plays at both ends of the floor. He was 0-5 from three-point range, but the misses didn’t seem to affect his willingness to trigger the next one. He attacked closeouts with dribble drives, dove for loose balls, and tried a few daring passes. He fouls a lot (five more in just 24 minutes), which needs to improve if he’s going to stay on the floor.
- Jordan Poole was kinda okay — 20 points on 20 shots, just 3-10 from three, five rebounds, nine assists, and two turnovers. Portland attacked him repeatedly on the defensive end, and he struggled mightily trying to navigate screens. He’d make a crafty, skillful shot or two, and then follow it up with some preposterous heat checks.
- Corey Kispert had a rough shooting night — 1-7 from three, including an airball from the corner that missed by 3-4 feet — but dished five assists and came up with two steals.
- Johnny Davis’ game last night was pretty close to the photorealistic sketch of how he might stick in the NBA. He largely hid on the offensive end (7.2% usage rate) and took shots only when wide open or at the rim. Otherwise, he defended and passed. Okay.
Four Factors
Below are the four factors that decide wins and losses in basketball — shooting (efg), rebounding (offensive rebounds), ball handling (turnovers), fouling (free throws made).
Stats & Metrics
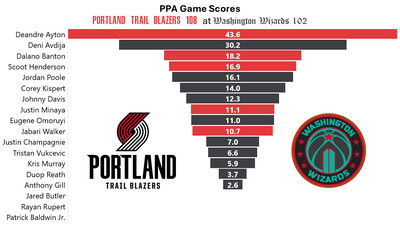
Below are a few performance metrics, including the Player Production Average (PPA) Game Score. PPA is my overall production metric, which credits players for things they do that help a team win (scoring, rebounding, playmaking, defending) and dings them for things that hurt (missed shots, turnovers, bad defense, fouls).
Game Score (GmSC) converts individual production into points on the scoreboard. The scale is the same as points and reflects each player’s total contributions for the game. The lowest possible GmSC is zero.
PPA is a per possession metric designed for larger data sets. In small sample sizes, the numbers can get weird. In PPA, 100 is average, higher is better and replacement level is 45. For a single game, replacement level isn’t much use, and I reiterate the caution about small samples sometimes producing weird results.
POSS is the number of possessions each player was on the floor in this game.
ORTG = offensive rating, which is points produced per individual possessions x 100. League average last season was 114.8. Points produced is not the same as points scored. It includes the value of assists and offensive rebounds, as well as sharing credit when receiving an assist.
USG = offensive usage rate. Average is 20%.
ORTG and USG are versions of stats created by former Wizards assistant coach Dean Oliver and modified by me. ORTG is an efficiency measure that accounts for the value of shooting, offensive rebounds, assists and turnovers. USG includes shooting from the floor and free throw line, offensive rebounds, assists and turnovers.
+PTS = “Plus Points” is a measure of the points gained or lost by each player based on their efficiency in this game compared to league average efficiency on the same number of possessions. A player with an offensive rating (points produced per possession x 100) of 100 who uses 20 possessions would produce 20 points. If the league average efficiency is 114, the league — on average — would produced 22.8 points in the same 20 possessions. So, the player in this hypothetical would have a +PTS score of -2.8.

