Stats, analysis, commentary.
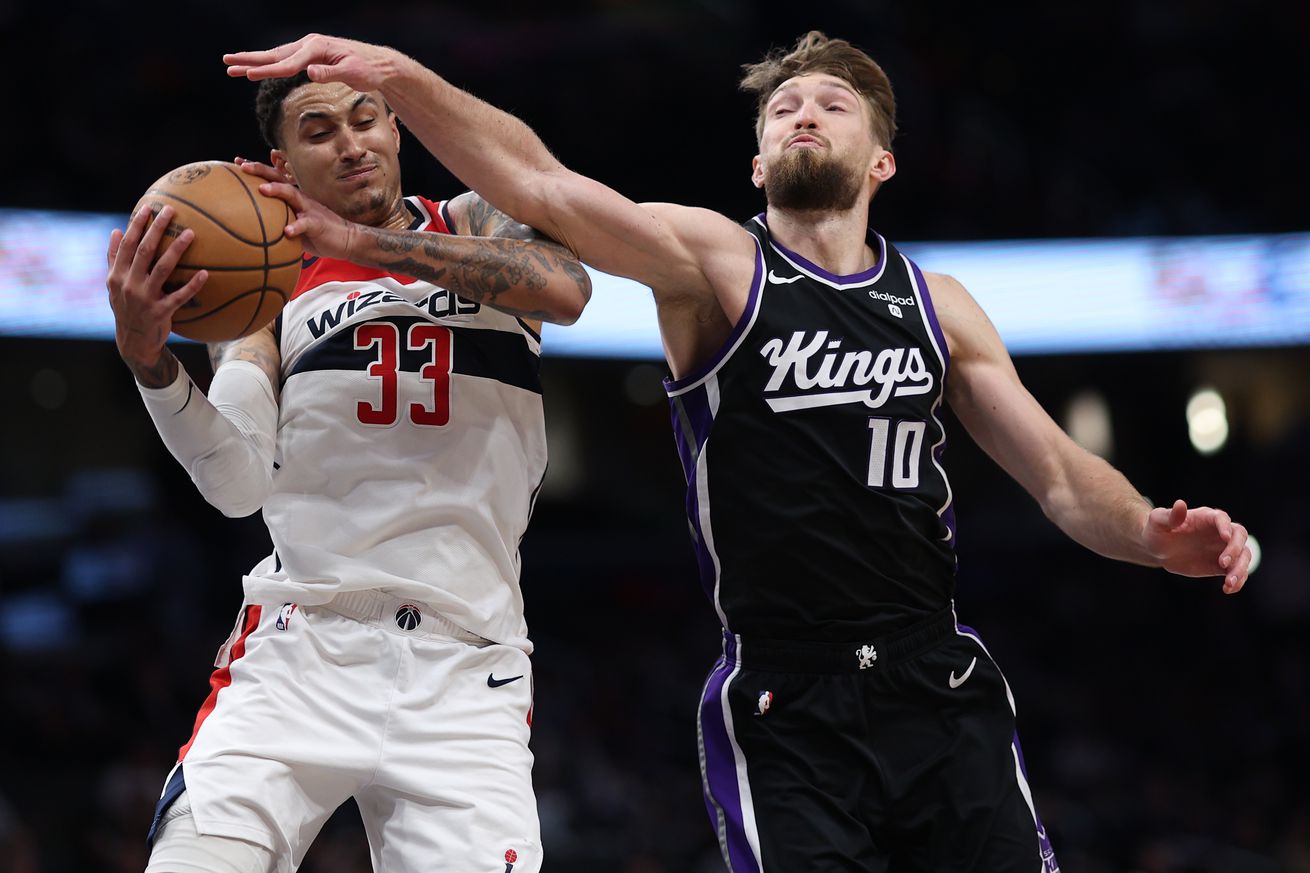
Kyle Kuzma, back in action after missing the last two games with a shoulder injury, was excellent, and everyone else was just good enough for the Wizards to claw out a surprising win against the visiting Sacramento Kings.
Kuzma led the way with 31 points, 6 rebounds and 5 assists. His shot-making was superb — 13-22 from the floor and 3-6 from deep, good for 65.9% effective field goal percentage. Five turnovers dragged his overall efficiency to about league average, but that was actually positive in this one. The Kings bricked their way to a 104 offensive rating (points per possession x 100), and the Wizards managed a 111. League average is 115.5.
Washington got positive contributions from nearly everyone else who took the floor:
- Corey Kispert couldn’t hit from deep (1-4) but kept attacking closeouts and converting inside. He finished with 15 points on nine field goal attempts — impressive efficiency considering the one made three and 2-6 shooting from the free throw line.
- Jordan Poole had a subpar (by league standards) offensive game but minimized the damage by not forcing shots and working on defense. He wound up with three steals, which helped offset his three turnovers.
- Deni Avidja, who missed the last three games with a knee injury, had one of those messy do a bunch of everything games that included good and bad. He scored 17 points on decent shooting — 7-14 from the floor, 2-3 from three, and he had nine rebounds and five assists. On defense, he helped harass De’Aaron Fox into an abysmal offensive night (10-30 shooting and three turnovers). And he also had three turnovers and shot just 1-3 from the free throw line. It was good to see him back in action.
- Patrick Baldwin Jr. scored six points in nine minutes plus two rebounds, a steal and a block. He attacked closeouts a couple times with more aggression than he’s previously shown.
- Richaun Holmes wasn’t very good except he had 16 rebounds (6 on the offensive end), and he made Domantas Sabonis fight for every inch inside and helped force the Kings’ All-Star center into six turnovers.
- Johnny Davis made a floater and grabbed three rebounds in 13 minutes.
- Anthony Gill scored eight points in 18 minutes on just four shots.
In the first half, Washington’s defensive plan seemed mostly to let the Kings miss open threes, which the Kings obligingly did. In the second half, the Wizards sensed an opportunity to get a win and seized it. Their defensive effort and execution improved, and they weathered repeated Sacramento attempts to complete a comeback.
With the win, Washington has a 12-58 record. That’s the league’s worst record — a half game behind the Detroit Pistons for second worst. The remaining schedule is significantly easier than it’s been the past few weeks. Even so, my prediction machine has the Wizards favored in just one game the rest of the way — March 29 against the Pistons.
However, the prediction machine thinks they’ll get 2-3 more victories over their final 12 games. That would mean 14 or 15 wins and in the three-way group that gets best draft lottery odds for drawing the top pick. For what it’s worth, their best chances at getting those two “extra” wins: Saturday night against the Toronto Raptors (41% chance of winning) and April 6 against the Portland Trail Blazers (49%).
Four Factors
Below are the four factors that decide wins and losses in basketball — shooting (efg), rebounding (offensive rebounds), ball handling (turnovers), fouling (free throws made).
Stats & Metrics
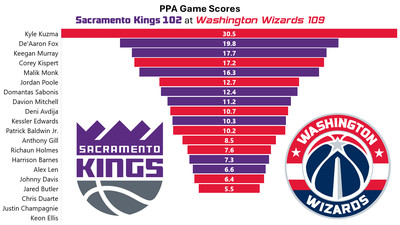
Below are a few performance metrics, including the Player Production Average (PPA) Game Score. PPA is my overall production metric, which credits players for things they do that help a team win (scoring, rebounding, playmaking, defending) and dings them for things that hurt (missed shots, turnovers, bad defense, fouls).
Game Score (GmSC) converts individual production into points on the scoreboard. The scale is the same as points and reflects each player’s total contributions for the game. The lowest possible GmSC is zero.
PPA is a per possession metric designed for larger data sets. In small sample sizes, the numbers can get weird. In PPA, 100 is average, higher is better and replacement level is 45. For a single game, replacement level isn’t much use, and I reiterate the caution about small samples sometimes producing weird results.
POSS is the number of possessions each player was on the floor in this game.
ORTG = offensive rating, which is points produced per individual possessions x 100. League average last season was 114.8. Points produced is not the same as points scored. It includes the value of assists and offensive rebounds, as well as sharing credit when receiving an assist.
USG = offensive usage rate. Average is 20%.
ORTG and USG are versions of stats created by former Wizards assistant coach Dean Oliver and modified by me. ORTG is an efficiency measure that accounts for the value of shooting, offensive rebounds, assists and turnovers. USG includes shooting from the floor and free throw line, offensive rebounds, assists and turnovers.
+PTS = “Plus Points” is a measure of the points gained or lost by each player based on their efficiency in this game compared to league average efficiency on the same number of possessions. A player with an offensive rating (points produced per possession x 100) of 100 who uses 20 possessions would produce 20 points. If the league average efficiency is 114, the league — on average — would produced 22.8 points in the same 20 possessions. So, the player in this hypothetical would have a +PTS score of -2.8.