Stats, analysis, commentary
The Wizards gave a solid effort that just wasn’t enough against a superior Minnesota Timberwolves squad. They also got some good luck in the form of the Timberwolves bricking open threes but were ultimately undone by rampant turnovers and giving up too many offensive rebounds.
The Timberwolves have the NBA’s number one defense, and they were stifling. Washington shot a decent percentage but committed 21 turnovers. Minnesota couldn’t shoot accurately from any range but they grabbed 15 offensive rebounds and had just seven turnovers. The differentials in turnovers and offensive boards allowed the Timberwolves to take 23 more field goal attempts than Washington.
The Wizards struggled against Minnesota’s Twin Towers lineup of Rudy Gobert and Karl-Anthony Towns. Daniel Gafford battled but was overwhelmed by the two seven-footers. Marvin Bagley III fared a bit better inside, collecting 15 rebounds in 26 minutes.
Washington got next to nothing from its guards. Tyus Jones had a rare-for-him bad game. Jordan Poole was even worse than usual.
Musings & Observations
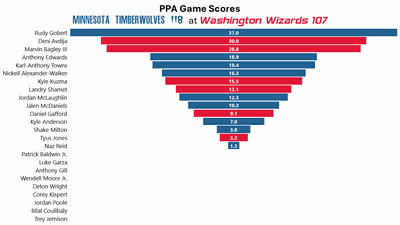
- Deni Avdija played well. He drove aggressively, drew fouls, and finished through contact. Final line: 24 points on 12 field goal attempts, 4-5 from three-point range (including a stepback corner three), 6 rebounds, 6 assists, and just 2 turnovers.
- As mentioned above, Bagley was excellent again — 17 points on 8 field goal attempts, 15 rebounds, and a steal in 26 minutes.
- Kyle Kuzma seemed more focused on playmaking than hunting his own shot, which I think could be a good thing if it continues. He finished with 17 points on 11 field goal attempts, shot 3-8 from three, and grabbed 14 rebounds (all defensive). He had 8 assists, which is good…but 5 turnovers, which is not.
- Poole had an awful game all the way around — 28 minutes, 7 points on 2-11 shooting, 2 rebounds, 3 assists, 4 turnovers, 3 fouls. Ugh. His shot selection was atrocious.
- Poor game from Bilal Coulibaly — 2-7 from the floor, 0-3 from deep, zero rebounds, 1 assist and 3 turnovers in 20 minutes.
- Timberwolves defenders did a good job running Corey Kispert off the three-point line. Kispert finished with zero three-point attempts, and committed three turnovers (two of which came as he tried to attack closeouts). He had four rebounds, but generally speaking, he can’t afford to turn the ball over — his value comes from producing efficient offense.
Four Factors
Below are the four factors that decide wins and losses in basketball — shooting (efg), rebounding (offensive rebounds), ball handling (turnovers), fouling (free throws made).
Stats & Metrics
Below are a few performance metrics, including the Player Production Average (PPA) Game Score. PPA is my overall production metric, which credits players for things they do that help a team win (scoring, rebounding, playmaking, defending) and dings them for things that hurt (missed shots, turnovers, bad defense, fouls).
Game Score (GmSC) converts individual production into points on the scoreboard. The scale is the same as points and reflects each player’s total contributions for the game. The lowest possible GmSC is zero.
PPA is a per possession metric designed for larger data sets. In small sample sizes, the numbers can get weird. In PPA, 100 is average, higher is better and replacement level is 45. For a single game, replacement level isn’t much use, and I reiterate the caution about small samples sometimes producing weird results.
POSS is the number of possessions each player was on the floor in this game.
ORTG = offensive rating, which is points produced per individual possessions x 100. League average last season was 114.8. Points produced is not the same as points scored. It includes the value of assists and offensive rebounds, as well as sharing credit when receiving an assist.
USG = offensive usage rate. Average is 20%.
ORTG and USG are versions of stats created by former Wizards assistant coach Dean Oliver and modified by me. ORTG is an efficiency measure that accounts for the value of shooting, offensive rebounds, assists and turnovers. USG includes shooting from the floor and free throw line, offensive rebounds, assists and turnovers.
+PTS = “Plus Points” is a measure of the points gained or lost by each player based on their efficiency in this game compared to league average efficiency on the same number of possessions. A player with an offensive rating (points produced per possession x 100) of 100 who uses 20 possessions would produce 20 points. If the league average efficiency is 114, the league — on average — would produced 22.8 points in the same 20 possessions. So, the player in this hypothetical would have a +PTS score of -2.8.