Stats, analysis, commentary
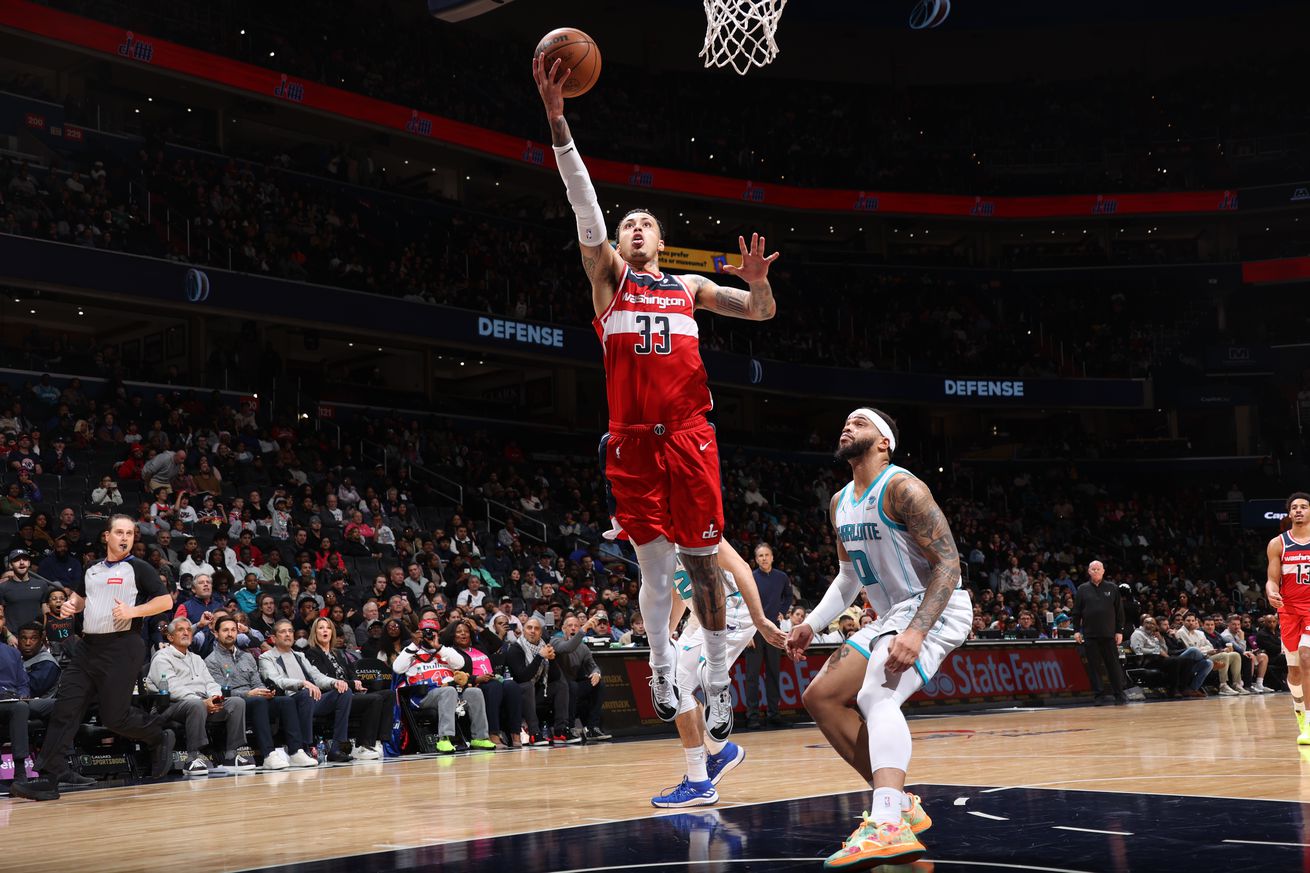
The Wizards got good games from Kyle Kuzma, Richaun Holmes, Deni Avdija, and Corey Kispert, and just enough from everyone else to defeat the Charlotte Hornets and snap their franchise record-tying 16-game losing streak.
Washington entered the game with the NBA’s second worst strength of schedule adjusted scoring margin. The team with the worst mark: the Charlotte Hornets. Add in homecourt advantage, and the Wizards were favored to win for the first time since their January 20 matchup with the San Antonio Spurs.
The Wizards currently have two more games over their final 19 where they should be favored — March 29 at home against the Detroit Pistons, and April 5 at home against the Portland Trail Blazers.
My prediction machine thinks they’ll scrounge another 2-3 wins, and that the Wizards will finish the year with 14 or 15 victories.
Last night’s win was more of an adventure than the team would have hoped. They got out to an early lead, the Hornets came back, and Washington trailed by as much as 10 points in the fourth quarter. And then, abruptly the Wizards couldn’t miss. They poured in 44 points in the fourth, won the period by 20 points, and coasted home with a 12-point win.
In the final period, Washington shot 16-20 from the floor, 2-4 from three-point range, and 10-10 from the free throw line. They produced 10 assists on 16 made field goals, and out-rebounded the Hornets 17-3 over the final 12 minutes.
The shooting numbers in the fourth are comical
- Deni Avdija: 5-5 with a three
- Richaun Homes: 3-3 (plus four free throws)
- Jordan Poole: 2-3 with a three, plus three rebounds, 5 assists, a steal and a block
- Kyle Kuzma: 6-9 plus five rebounds and three assists
Musings & Observations
- I didn’t think Kuzma was playing particularly well, but he produced in the fourth quarter. The three-point shooting was brutal (not just for him — the team was 6-33 from three), but he set up teammates (9 assists) and committed just 2 turnovers.
- Good all-around game for Avdija. He struggled to get shots to fall through the first three quarters (3-9 from the floor), but delivered in the fourth quarter.
- Corey Kispert was productive despite not making threes (just 1-5). He had four rebounds and two assists, and he shot 6-6 from the free throw line.
- Bilal Coulibaly was okay — 15.7% usage, 11 points, 4 rebounds. I did not think he had a good defensive game.
- Poole had one of those bifurcated games he’s been turning in lately. He was terrible through three quarters, and then played a very good final period. Overall, he was pretty bad — 6-17 from the floor, including some really ugly “created” shots, 2-10 from three, and four turnovers. His offensive rating (points produced per possession x 100) was 82 on a 29.1% usage rate.
Four Factors
Below are the four factors that decide wins and losses in basketball — shooting (efg), rebounding (offensive rebounds), ball handling (turnovers), fouling (free throws made).
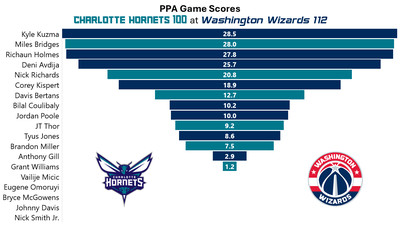
Stats & Metrics
Below are a few performance metrics, including the Player Production Average (PPA) Game Score. PPA is my overall production metric, which credits players for things they do that help a team win (scoring, rebounding, playmaking, defending) and dings them for things that hurt (missed shots, turnovers, bad defense, fouls).
Game Score (GmSC) converts individual production into points on the scoreboard. The scale is the same as points and reflects each player’s total contributions for the game. The lowest possible GmSC is zero.
PPA is a per possession metric designed for larger data sets. In small sample sizes, the numbers can get weird. In PPA, 100 is average, higher is better and replacement level is 45. For a single game, replacement level isn’t much use, and I reiterate the caution about small samples sometimes producing weird results.
POSS is the number of possessions each player was on the floor in this game.
ORTG = offensive rating, which is points produced per individual possessions x 100. League average last season was 114.8. Points produced is not the same as points scored. It includes the value of assists and offensive rebounds, as well as sharing credit when receiving an assist.
USG = offensive usage rate. Average is 20%.
ORTG and USG are versions of stats created by former Wizards assistant coach Dean Oliver and modified by me. ORTG is an efficiency measure that accounts for the value of shooting, offensive rebounds, assists and turnovers. USG includes shooting from the floor and free throw line, offensive rebounds, assists and turnovers.
+PTS = “Plus Points” is a measure of the points gained or lost by each player based on their efficiency in this game compared to league average efficiency on the same number of possessions. A player with an offensive rating (points produced per possession x 100) of 100 who uses 20 possessions would produce 20 points. If the league average efficiency is 114, the league — on average — would produced 22.8 points in the same 20 possessions. So, the player in this hypothetical would have a +PTS score of -2.8.