Stats, analysis and commentary.
No Kyle Kuzma, no Tyus Jones, no G Leaguers, no problem. Last night the Wizards beat the Milwaukee Bucks, 117-113, in a sloppy, messy, competitive contest.
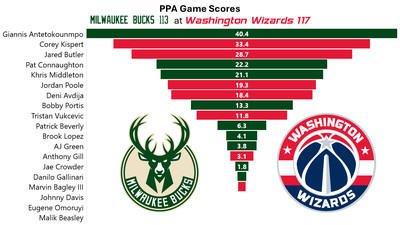
The Wizards won despite an outstanding performance from two-time MVP Giannis Antetokounmpo (35 points, 15 rebounds, 10 assists, 71.4% effective field goal percentage, 143 offensive rating).
For the Bucks, Pat Connaugton had a good game, as did Khris Middleton and Bobby Portis. And it wasn’t enough.
Washington was led by efficient scoring from Corey Kispert (27 points on 18 shots, plus seven rebounds), a freakishly terrific performance from Jared Butler ( 17 points on 10 shots), and pretty solid games from Jordan Poole, Deni Avdija and rookie big Tristan Vukcevic.
Milwaukee’s efg for the game was just 49.0%, which is terrible. I hesitate to attribute that to the Wizards defense because of the number of open and wide-open threes the Bucks missed. For the game, Milwaukee shot 22.9% from three (11-48).
The Wizards didn’t get as much advantage from Milwaukee’s atrocious shooting as might be expected because they shot the three so poorly themselves — 9-38 (23.7%). Washington gained modest advantage in turnovers (12 for the Bucks to Washington’s 10) and free throws (14-12). They got dominated on the boards — 18-5 on the offensive glass, and 57-44 overall.
They won because of two related factors — better two point percentage (69.1% to 61.8%) and outscoring the Bucks in the paint 70-56. Yes, the lowly Wizards outscored Giannis and the Bucks by 14 in the paint.
Musings & Observations
- Kispert didn’t shoot great from three-point range, but he scored efficiently on drives and cuts, grabbed seven rebounds, and was at least not a problem on defense.
- Jared Butler went on a much-needed heater that kept Washington afloat when the Bucks were on a run and threatening to take the game back. He knocked down all three of his three-point attempts and had three rebounds, three assists and two steals in just under 18 minutes.
- Jordan Poole’s decision-making was an adventure and gave the Bucks chances to steal a win late, but he also did an excellent job of getting into the paint and finding open teammates. He finished with 13 assists and three turnovers — an excellent 4.3 to 1 assist-to-turnover ratio. The playmaking boosted his offensive rating (points produced per possession x 100) to 111 — a high number given his poor shooting (46.4% efg — 6-14 from the floor and 1-6 from three).
- A pretty normal game from Deni Avdija. The glory stats look good — 23 points, 8 rebounds, 5 assists. He missed all five of his three-point attempts but was still 10-17 from the field because his other 12 shots were all from inside the paint, and he made 10 of them. He committed three turnovers, which is too many compared to his five assists. The team defense was at its best when he was in the game.
- Stepping into the void created by Marvin Bagley III’s apparent knee injury, Tristan Vukcevic got almost as many minutes against Milwaukee (31) as he’d played in his previous five games combined. And, he wasn’t bad — 14 points, 7 rebounds, 3 assists and a steal. His offensive efficiency was about league average, and after a few welcome to the NBA rookie plays from Antetokounmpo and Brook Lopez, Vukcevic went right back at them. He got into some foul trouble, which is pretty normal for a rookie big man in the sixth game of his NBA career.
- I’m saying this in full “Old Man Yells at Cloud” mode: the NBA needs to call carries. Antetokounmpo is blatant in his carries — he repeatedly picks up his dribble, pauses, and then dribbles again. Poole could be called for a carry on nearly every dribble. He had 3-4 obvious carries against Milwaukee. So did Avdija. So did Pat Beverly for the Bucks. I’m not saying we need to go back to 1950s tap-tap-tap ball handling, but when a player puts his hand under the ball, he shouldn’t be permitted to dribble again.
- Oh yeah, listened to while writing: a wonderful recording of Giant Steps by Tommy Flanagan — piano, George Mraz — bass, and Al Foster — drums. The album and this recording were tribute to John Coltrane, who composed this piece.
Four Factors
Below are the four factors that decide wins and losses in basketball — shooting (efg), rebounding (offensive rebounds), ball handling (turnovers), fouling (free throws made).
Stats & Metrics
Below are a few performance metrics, including the Player Production Average (PPA) Game Score. PPA is my overall production metric, which credits players for things they do that help a team win (scoring, rebounding, playmaking, defending) and dings them for things that hurt (missed shots, turnovers, bad defense, fouls).
Game Score (GmSC) converts individual production into points on the scoreboard. The scale is the same as points and reflects each player’s total contributions for the game. The lowest possible GmSC is zero.
PPA is a per possession metric designed for larger data sets. In small sample sizes, the numbers can get weird. In PPA, 100 is average, higher is better and replacement level is 45. For a single game, replacement level isn’t much use, and I reiterate the caution about small samples sometimes producing weird results.
POSS is the number of possessions each player was on the floor in this game.
ORTG = offensive rating, which is points produced per individual possessions x 100. League average last season was 114.8. Points produced is not the same as points scored. It includes the value of assists and offensive rebounds, as well as sharing credit when receiving an assist.
USG = offensive usage rate. Average is 20%.
ORTG and USG are versions of stats created by former Wizards assistant coach Dean Oliver and modified by me. ORTG is an efficiency measure that accounts for the value of shooting, offensive rebounds, assists and turnovers. USG includes shooting from the floor and free throw line, offensive rebounds, assists and turnovers.
+PTS = “Plus Points” is a measure of the points gained or lost by each player based on their efficiency in this game compared to league average efficiency on the same number of possessions. A player with an offensive rating (points produced per possession x 100) of 100 who uses 20 possessions would produce 20 points. If the league average efficiency is 114, the league — on average — would produced 22.8 points in the same 20 possessions. So, the player in this hypothetical would have a +PTS score of -2.8.