Stats, analysis, commentary.
The team that shoots better wins nearly 80% of the time in the NBA. The Wizards outshot the Philadelphia 76ers 64.1% to 55.4% (effective field goal percentage).
A team that makes four or more three-pointers than their opponent wins about 75% of the time in the NBA. The Wizards were +6.
Naturally, they lost anyway.
This time, the causes were offensive rebounding (-9) and free throws (-21 from the free throw line). To be clear, the free throw difference is not evidence of conspiracy or even poor officiating. The Sixers were feeding Joel Embiid, a force of nature for which the Wizards had no answers, and Washington has not a single player on the roster with the offensive chops to force fouls.
None of the forgoing should be construed to suggest the Wizards played poorly. While some individual players could have performed better, in truth this was about as well as this roster could play. They made shots, avoided turnovers, and gave defensive effort. They also had defensive breakdowns and mistakes, got crushed on the offensive glass, and got demolished by one of the game’s best players. It happens.
This is also not to award a moral victory. They competed, which is a minimal bar in professional sports. The game illustrates how far the Wizards need to go. Their best player would be third or fourth on Philadelphia’s roster (I’d be open to arguments that Kyle Kuzma is better than De’Anthony Melton for third best on Philly).
Musings & Observations
- A hyper-efficient, virtually mistake free game from Tyus Jones — 20 points on 11 shots, 8 assists to 1 turnover. Jones, by the way, is 92nd percentile in pick-and-roll efficiency this season. Jordan Poole is 49th percentile. Kuzma is 34th. Naturally, the Wizards have run more pick-and-roll for Poole and Kuzma this season.
- Corey Kispert was on the floor for 54 possessions. He launched five threes and made four. That’s the anatomy of a good game from him.
- Daniel Gafford got torched by Embiid. He didn’t go down without a fight though — 18 points on 8-10 shooting, 6 rebounds, 4 assists, a steal, and 2 blocks. He also fouled out in 23 minutes. Tracking data said he led the game with 11 contested shots.
- Good performance from rookie Bilal Coulibaly. He was active offensively, faked a handoff and drove to the rim for a dunk, picked Embiid’s dribble and threw down another dunk, and generally made a pest of himself on the defensive end. It was good to see him use his athleticism to make strong and aggressive moves rather than Euro-stepping.
- There was a lot of online chatter during the game about this being one of Poole’s best games since coming to the Wizards, and I could sorta side-eye squint my way into seeing it. Almost. To me, the decision making looked about the same. What looked better was simply that he made shots (10-16 from the floor and 3-5 from three). In 32 minutes, he also had 1 rebound, 2 assists, 1 steal, 3 turnovers, and 3 fouls. That’s not good. His overall offensive efficiency was still 3.5 points per 100 possessions below league average.
- Kuzma had a relatively weak game. His shooting was meh 50.0% efg, and he managed just three rebounds in 34 minutes. The playmaking (7 assists) was nice. He was no help defensively outside of one excellent block.
- It wasn’t a good game from Deni Avdija, but it wasn’t exactly bad either. He definitely shot poorly and committed two turnovers, but he also had 8 defensive rebounds, 8 assists and a block.
- Embiid, by the way, had monster glory stats — 50 points, 13 rebounds, 7 assists. He shot 19-29 from the floor, 1-2 from deep, and 11-13 on free throws. He also had 6 turnovers. Still, all that tallies to a 133 offensive rating (points produced per possession x 100) on 44.2% usage.
- Maxey is impressive — 26 points, 7 assists, zero turnovers. He was blazing fast and in control at the same time. Excellent passing and decision making. And he’s shooting nearly 40% from three so far this season, which is a drop-off from the past couple seasons.
Four Factors
Below are the four factors that decide wins and losses in basketball — shooting (efg), rebounding (offensive rebounds), ball handling (turnovers), fouling (free throws made).
Stats & Metrics
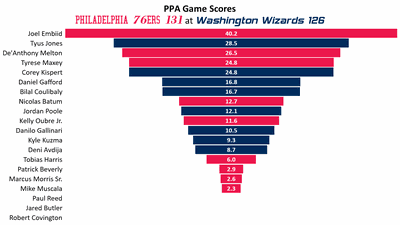
Below are a few performance metrics, including the Player Production Average (PPA) Game Score. PPA is my overall production metric, which credits players for things they do that help a team win (scoring, rebounding, playmaking, defending) and dings them for things that hurt (missed shots, turnovers, bad defense, fouls).
Game Score (GmSC) converts individual production into points on the scoreboard. The scale is the same as points and reflects each player’s total contributions for the game. The lowest possible GmSC is zero.
PPA is a per possession metric designed for larger data sets. In small sample sizes, the numbers can get weird. Reminder: in PPA, 100 is average, higher is better and replacement level is 45. For a single game, replacement level isn’t much use, and I reiterate the caution about small samples sometimes producing weird results.
POSS is the number of possessions each player was on the floor in this game.
ORTG = offensive rating, which is points produced per individual possessions x 100. League average last season was 114.8. Points produced is not the same as points scored. It includes the value of assists and offensive rebounds, as well as sharing credit when receiving an assist.
USG = offensive usage rate. Average is 20%.
ORTG and USG are versions of stats created by Wizards assistant coach Dean Oliver and modified by me. ORTG is an efficiency measure that accounts for the value of shooting, offensive rebounds, assists and turnovers. USG includes shooting from the floor and free throw line, offensive rebounds, assists and turnovers.
+PTS = “Plus Points” is a measure of the points gained or lost by each player based on their efficiency in this game compared to league average efficiency on the same number of possessions. A player with an offensive rating (points produced per possession x 100) of 100 who uses 20 possessions would produce 20 points. If the league average efficiency is 114, the league — on average — would produced 22.8 points in the same 20 possessions. So, the player in this hypothetical would have a +PTS score of -2.8.