Stats, analysis, commentary.
The Los Angeles Lakers withstood a hot start from the Wizards, took care of business, and departed an Eastern Conference quasi home game with a win.
The final 125-120 margin was superficially close because of an 8-0 run by the Wizards bench against the Lakers bench that came after Washington interim head coach Brian Keefe had effectively conceded the game.
Lakers coach Darvin Ham benched his bench, reinserting starters LeBron James, Anthony Davis, Rui Hachimura, and Austin Reaves for the final 17 seconds to secure the victory. Fittingly, the final play was Davis blocking a Jared Butler three-point attempt, and James securing the rebound.
The game itself was what Wizards games have been lately — sloppy but competitive and try-hard. The Lakers are simply the better team, especially when Davis scores 35 points on 17 shots (15-15 from the free throw line), James puts up 25-7-9 and orchestrates every key possession, and Hachimura shoots 9-12 from the floor.
The Wizards did have some good stuff during the game:
- Justin Champagnie returned from G League assignment to score 13 points and grab 7 rebounds in 19 minutes. He hit 3-5 from three-point range. This was likely the best NBA game of his young career.
- Jordan Poole scored 29 points on 19 field goal attempts and came up with a couple nice steals. He had three turnovers to five assists, which isn’t great, but his offensive rating (points produced per possession x 100) was an excellent 127 on 28.6% usage. This version of Poole — who used skill, craft and quickness to create makeable shots — is a useful offensive player. The defense was not good with Poole out there, though the breakdowns didn’t seem to be primarily his responsibility, at least on live watch.
- Tristan Vukcevic got his first start and wasn’t bad. He hit shots (5-9 from the floor and 3-6 from deep) and tried on defense. His recognition and rotations are a beat slow, which is unsurprising considering it was his seventh NBA game. The thing I like most about him is that he’s trying to make plays. The combination of slow recognition and desire to make things happen is at least part of why he fouls so much (five in just 21 minutes last night), but that’s the sort of thing that usually improves with experience.
In the not so good category:
- Deni Avdija caught an inadvertent but very hard elbow to the face from James in the second quarter. Avdija stayed in the game until halftime but didn’t return due to what the team called a “migraine.” I would not be surprised to learn he’s in the concussion protocol.
- Kyle Kuzma’s return to action after missing a game with a shoulder injury was rough. He needed 16 shots to score 17 points, and while he collected 12 rebounds, he committed four turnovers.
- As I’ve mentioned a few times over the years, the team that shoots better wins about 80% of the time in the NBA. The Wizards once again managed to outshoot an opponent and lose. The Lakers overcame a shooting deficit that included being -30 from three-point range by dominating the boards (11-6 on the offensive glass, 49-39 overall), committing fewer turnovers (16-18) and winning at the free throw line (25-12).
Four Factors
Below are the four factors that decide wins and losses in basketball — shooting (efg), rebounding (offensive rebounds), ball handling (turnovers), fouling (free throws made).
Stats & Metrics
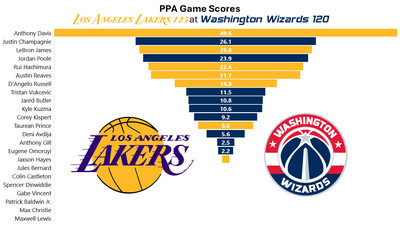
Below are a few performance metrics, including the Player Production Average (PPA) Game Score. PPA is my overall production metric, which credits players for things they do that help a team win (scoring, rebounding, playmaking, defending) and dings them for things that hurt (missed shots, turnovers, bad defense, fouls).
Game Score (GmSC) converts individual production into points on the scoreboard. The scale is the same as points and reflects each player’s total contributions for the game. The lowest possible GmSC is zero.
PPA is a per possession metric designed for larger data sets. In small sample sizes, the numbers can get weird. In PPA, 100 is average, higher is better and replacement level is 45. For a single game, replacement level isn’t much use, and I reiterate the caution about small samples sometimes producing weird results.
POSS is the number of possessions each player was on the floor in this game.
ORTG = offensive rating, which is points produced per individual possessions x 100. League average last season was 114.8. Points produced is not the same as points scored. It includes the value of assists and offensive rebounds, as well as sharing credit when receiving an assist.
USG = offensive usage rate. Average is 20%.
ORTG and USG are versions of stats created by former Wizards assistant coach Dean Oliver and modified by me. ORTG is an efficiency measure that accounts for the value of shooting, offensive rebounds, assists and turnovers. USG includes shooting from the floor and free throw line, offensive rebounds, assists and turnovers.
+PTS = “Plus Points” is a measure of the points gained or lost by each player based on their efficiency in this game compared to league average efficiency on the same number of possessions. A player with an offensive rating (points produced per possession x 100) of 100 who uses 20 possessions would produce 20 points. If the league average efficiency is 114, the league — on average — would produced 22.8 points in the same 20 possessions. So, the player in this hypothetical would have a +PTS score of -2.8.