Stats, analysis, commentary
The Washington Wizards are so non-competitive that it’s almost pointless to analyze any single game. Last night, they took on a Toronto Raptors team sitting 12th in the East despite a recent hot streak and got mauled.
How bad was it?
- The Wizards didn’t score for the first 5:09.
- The Wizards highest-scoring quarter was the garbage time 4th when they managed just 24 points. In the first three quarters, they scored 18, 20, and 20.
- The Wizards had their worst offensive outing of the year (an 83 offensive rating) against the NBA’s 26th ranked defense.
- The Raptors won by 24 despite a 107 offensive rating. That’s 6.5 points per 100 possessions below average, and 3.5 points below their own season average. Oh yeah, Toronto was ranked 23rd in offense.
- In this game, Washington never led, and there were no ties after 0-0. The Raptors led by as much as 29 and won by 24.
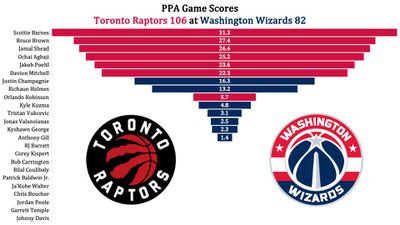
- In my PPA metric (see below), only two Wizards had games that rated above league average (in PPA, 100 is average and higher is better) — Justin Champagnie, who played 15 minutes (mostly in garbage time), and Richaun Holmes, who played 16 minutes (many of which came in garbage time).
- In my PPA metric, no starter had a game that rated above replacement level. The closest was Kyle Kuzma, who probably was hailed in the Monumental postgame show for an epic double-double (19 points, 10 rebounds), but who in truth played yet another abysmal game. Kuzma’s eFG% was 50.0%. League average is 54.0%. He managed one offensive rebound, and one assist in 34 minutes while committing three turnovers. His offensive rating was 93, which is more than 20 points per 100 possessions below league average.
- Washington shot 5-30 from three-point range and committed 25 turnovers. Bilal Coulibaly led the team with 4 turnovers.
- Jordan Poole was awful — 1-9 from the floor, 0-5 from three, and 2 assists vs. 3 turnovers.
Did anything good happen for the Wizards?
- Not really.
- Champagnie had 12 points, 6 rebounds, 2 steals, and 2 blocks in 15 minutes.
I mentioned earlier that this was Washington’s worst offensive rating of the season. Somehow, it’s only the seventh worst among all teams of 2024-25. Here’s the ignominious 10:
- Brooklyn Nets — Jan. 15 — 70
- Toronto Raptors — Dec. 31 — 75
- Los Angeles Clippers — Dec. 4 — 81
- Portland Trail Blazers — Nov. 10 — 82
- Chicago Bulls — Oct. 26 — 83
- Utah Jazz — Oct. 25 — 83
- Washington Wizards — Jan. 29 — 83
- Portland Trail Blazers — Nov. 22 — 85
- Los Angeles Lakers — Dec. 2 — 85
- Orlando Magic — Nov. 4 — 85
Going forward, I’m probably going to write less about the individual games, especially when they’re like this one. There are more interesting topics to analyze. Probably.
Four Factors
Below are the four factors that decide wins and losses in basketball — shooting (efg), rebounding (offensive rebounds), ball handling (turnovers), fouling (free throws made).
The four factors are measured by:
- eFG% (effective field goal percentage, which accounts for the three-point shot)
- OREB% (offensive rebound percentage)
- TOV% (turnover percentage — turnovers divided by possessions)
- FTM/FGA (free throws made divided by field goal attempts)
In the table below are the four factors using the percentages and rates traditionally presented. There’s also a column showing league average in each of the categories to give a sense of each team’s performance relative to the rest of the league this season.
Stats & Metrics
Below are a few performance metrics, including the Player Production Average (PPA) Game Score. PPA is my overall production metric, which credits players for things they do that help a team win (scoring, rebounding, playmaking, defending) and dings them for things that hurt (missed shots, turnovers, bad defense, fouls).
Game Score (GmSC) converts individual production into points on the scoreboard. The scale is the same as points and reflects each player’s total contributions for an average NBA game. The lowest possible GmSC is zero.
PPA is a per possession metric designed for larger data sets. In small sample sizes, the numbers can get weird. In PPA, 100 is average, higher is better and replacement level is 45. For a single game, replacement level isn’t much use, and I reiterate the caution about small samples sometimes producing weird results.
POSS is the number of possessions each player was on the floor in this game.
ORTG = offensive rating, which is points produced per individual possessions x 100. League average last season was 114.8. Points produced is not the same as points scored. It includes the value of assists and offensive rebounds, as well as sharing credit when receiving an assist.
USG = offensive usage rate. Average is 20%.
ORTG and USG are versions of stats created by former Wizards assistant coach Dean Oliver and modified by me. ORTG is an efficiency measure that accounts for the value of shooting, offensive rebounds, assists and turnovers. USG includes shooting from the floor and free throw line, offensive rebounds, assists and turnovers.
+PTS = “Plus Points” is a measure of the points gained or lost by each player based on their efficiency in this game compared to league average efficiency on the same number of possessions. A player with an offensive rating (points produced per possession x 100) of 100 who uses 20 possessions would produce 20 points. If the league average efficiency is 114, the league — on average — would produced 22.8 points in the same 20 possessions. So, the player in this hypothetical would have a +PTS score of -2.8.
by Kevin Broom