Stats, analysis, commentary.
In the second night of a back-to-back in Los Angeles, the Washington Wizards got thumped by the Clippers, 140-115.
It was a case of the Clippers playing well, and the Wizards being tired after an overtime loss to the Lakers the night before, and playing poorly on both ends of the floor. Washington defenders kept leaving Clippers open at the three-point line, which is generally a bad idea in the NBA, and specifically a bad idea with the Clippers — they’re third in team three-point percentage so far this season.
The Clippers got efficient, effective production from everyone in the rotation except Mason Plumlee and Bones Hyland. In fairness to Hyland, he got second half rotation minutes only because Russell Westbrook fractured a bone in his hand trying to poke the ball loose from Jordan Poole.
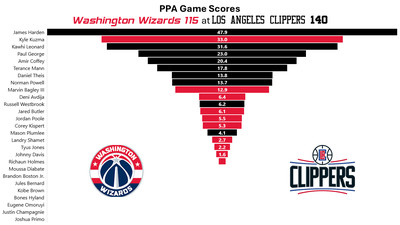
James Harden was excellent — 28 points on 13 shots, 6-9 from three-point range, plus 8 assists and 3 blocks. He is skilled at the defensive art of slapping down on the ball and getting ball.
As for the Wizards, Kyle Kuzma was excellent and everyone else was not. Kuzma finished with 32 points in 29 minutes on 13-19 shooting. He shot 5-7 on threes and committed just one turnover.
Next up for the Wizards: a trip to Salt Lake City to face the Utah Jazz. Washington will be trying to avoid running their losing streak to 15.
Musings & Observations
- While Kuzma had little help, Marvin Bagley III at least tried — 10 points, 10 rebounds — 6 offensive boards. His defense is okay at best, though he’s running into some of the same challenges Daniel Gafford faced covering for frequent breakdowns on the perimeter.
- Deni Avdija had some positive moments, though his overall performance was blah. His name was on the injury report due to the heel contusion that kept him out for a few days. That didn’t seem to be an issue last night — he just missed some shots he’s been making at a higher rate this season.
- Poole’s night overall wasn’t good — subpar shooting and too many fouls (four in 21 minutes is a lot). One thing I did like was what might be developing pick-and-roll chemistry with Bagley. Still, this was a pretty average game by Poole this season, which is to say it was not good.
- Corey Kispert hunted shots but had trouble finding them, though he did have a nifty finish inside. He had next to zero non-scoring production.
- The starting backcourt — Tyus Jones and Landry Shamet — flat stunk. They were thoroughly outplayed by Harden and Terance Mann. The Washington duo combined to shoot 3-13 from the floor and 2-10 from three.
- Another rough outing for Johnny Davis. He’s getting some minutes and struggling mightily. His shot mechanics are worrisome and need a complete rebuild. He has a busy summer ahead of him if he hopes to stay in the NBA.
Four Factors
Below are the four factors that decide wins and losses in basketball — shooting (efg), rebounding (offensive rebounds), ball handling (turnovers), fouling (free throws made).
Stats & Metrics
Below are a few performance metrics, including the Player Production Average (PPA) Game Score. PPA is my overall production metric, which credits players for things they do that help a team win (scoring, rebounding, playmaking, defending) and dings them for things that hurt (missed shots, turnovers, bad defense, fouls).
Game Score (GmSC) converts individual production into points on the scoreboard. The scale is the same as points and reflects each player’s total contributions for the game. The lowest possible GmSC is zero.
PPA is a per possession metric designed for larger data sets. In small sample sizes, the numbers can get weird. In PPA, 100 is average, higher is better and replacement level is 45. For a single game, replacement level isn’t much use, and I reiterate the caution about small samples sometimes producing weird results.
POSS is the number of possessions each player was on the floor in this game.
ORTG = offensive rating, which is points produced per individual possessions x 100. League average last season was 114.8. Points produced is not the same as points scored. It includes the value of assists and offensive rebounds, as well as sharing credit when receiving an assist.
USG = offensive usage rate. Average is 20%.
ORTG and USG are versions of stats created by former Wizards assistant coach Dean Oliver and modified by me. ORTG is an efficiency measure that accounts for the value of shooting, offensive rebounds, assists and turnovers. USG includes shooting from the floor and free throw line, offensive rebounds, assists and turnovers.
+PTS = “Plus Points” is a measure of the points gained or lost by each player based on their efficiency in this game compared to league average efficiency on the same number of possessions. A player with an offensive rating (points produced per possession x 100) of 100 who uses 20 possessions would produce 20 points. If the league average efficiency is 114, the league — on average — would produced 22.8 points in the same 20 possessions. So, the player in this hypothetical would have a +PTS score of -2.8.