Stats, analysis, commentary.
In the first night of their back-to-back in Los Angeles, the Washington Wizards played well and pushed Anthony Davis, LeBron James and the Lakers to overtime before running out of steam and losing their 13th in a row.
Jordan Poole came off the bench to score 34 points on solid efficiency. To my eyes, it might have been his best game of the season. His shot selection was okay after an early (and god-awful) floater-push-heave thing that had no chance of going in. His first heat check didn’t come until probably the fourth quarter.
Better, he did some playmaking for teammates and could easily have had double-digit assists if those teammates made shots they normally convert. It wasn’t a perfect game by any stretch — three turnovers, four fouls, and a few head-scratching gaffes that cost the team on defense.
Still, this is the kind of game that should have been reasonably anticipated when the Wizards acquired him.
Deni Avdija returned to action after missing a few games with a heel injury, and he looked pretty good — 15 point, 15 rebounds, 5 assists. James dared him to shoot, and Avdija obliged, knocking down 3-5 from deep. Avdija spent much of the night defending James, and he did well as anyone can do against one of the all-time greats, who’s still really good. James finished the night with 31 points and 9 assists, though it took 24 shots and 4 turnovers to get there.
Marvin Bagley III was excellent on the offensive end — 23 points on 14 shots. On defense…well…Davis scored a highly-efficient 40 points, and collected 15 rebounds and 4 assists.
Corey Kispert was on his way to a great game until he lost the range on his threes. He still finished with a nice stat line — 20 points, 6 rebounds, 6 assists.
Kyle Kuzma was pretty good against his old team — 20 points, 10 rebounds, 4 assists, 3 blocks. His shooting was good (4-8 from three), and his overall efficiency hit league average (a good mark for him — he’s been -12 to -13 points produced per 100 possessions relative to league average most of the season).
Old friend Rui Hachimura played 35 minutes, scoring eight points and collecting seven rebounds. He fell asleep a few times defending off-ball — Poole got an open three against him a simple pin-down in the first quarter, for example.
Another former Wizards player, Spencer Dinwiddie, also played. The stat book says he scored 10 points and had 3 assists, though casual observers could be forgiven for forgetting his inconsequential performance.
The Wizards are back in action Friday night against the Los Angeles Clippers.
Four Factors
Below are the four factors that decide wins and losses in basketball — shooting (efg), rebounding (offensive rebounds), ball handling (turnovers), fouling (free throws made).
Stats & Metrics
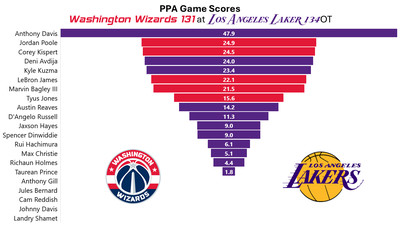
Below are a few performance metrics, including the Player Production Average (PPA) Game Score. PPA is my overall production metric, which credits players for things they do that help a team win (scoring, rebounding, playmaking, defending) and dings them for things that hurt (missed shots, turnovers, bad defense, fouls).
Game Score (GmSC) converts individual production into points on the scoreboard. The scale is the same as points and reflects each player’s total contributions for the game. The lowest possible GmSC is zero.
PPA is a per possession metric designed for larger data sets. In small sample sizes, the numbers can get weird. In PPA, 100 is average, higher is better and replacement level is 45. For a single game, replacement level isn’t much use, and I reiterate the caution about small samples sometimes producing weird results.
POSS is the number of possessions each player was on the floor in this game.
ORTG = offensive rating, which is points produced per individual possessions x 100. League average last season was 114.8. Points produced is not the same as points scored. It includes the value of assists and offensive rebounds, as well as sharing credit when receiving an assist.
USG = offensive usage rate. Average is 20%.
ORTG and USG are versions of stats created by former Wizards assistant coach Dean Oliver and modified by me. ORTG is an efficiency measure that accounts for the value of shooting, offensive rebounds, assists and turnovers. USG includes shooting from the floor and free throw line, offensive rebounds, assists and turnovers.
+PTS = “Plus Points” is a measure of the points gained or lost by each player based on their efficiency in this game compared to league average efficiency on the same number of possessions. A player with an offensive rating (points produced per possession x 100) of 100 who uses 20 possessions would produce 20 points. If the league average efficiency is 114, the league — on average — would produced 22.8 points in the same 20 possessions. So, the player in this hypothetical would have a +PTS score of -2.8.