Stats, commentary, analysis.
Last night’s loss to the Indiana Pacers was more encouraging than the preceding one to the Boston Celtics. Sure, Boston is the better team, and the final margin was the same (12 points), but in this one, the kids did the heavy lifting. Bouncing back from their performances against the Celtics, Washington’s leaders against the Pacers in scoring, rebounding, assists, steals and blocks were 20 years old or younger.
Better, while each of the youngsters made some good plays, the coaching staff will have an abundance of teachable moments when they get to the video review.
Some takeaways:
- Bilal Coulibaly turned down some shots the team surely wants him to take, but still turned in a strong overall performance — 142 offensive rating (points produced per possession x 100) on a 17.0% usage rate. He tied for the team lead with 17 points while shooting 4-9 from the floor, 2-5 from deep, and getting to the free throw line eight times. His defense was pretty good, and he had 6 rebounds, 4 assists, a steal, and 2 (impressive) blocks to just 1 turnover and 2 fouls.
- Alex Sarr had some maddening moments (fading away on shots instead of going up strong, not getting back on defense, losing track of his man and/or failing to communicate on switches), and yet, he scored 17 points, set a new career high with 14 rebounds, and came up with a steal and two blocks.
- Kyshawn George seems perpetually confused by what constitutes a foul in basketball, but he scored 15 points on eight shots, and had five rebounds and five assists. Solid performance from him in his return to the starting lineup.
- Malcolm Brogdon played a solid and heady game, though he missed a few shots he typically makes. He’s not as fast as he once was, but he’s crafty and makes good decisions constantly. That’s what the youngsters need from a veteran.
- Bub Carrington shot poorly (2-7 from the floor) and committed three turnovers, and he contributed a couple assists, two steals and a block.
- Jared Butler notched a negative PPA, but when he entered the game, the Wizards had committed turnovers on five consecutive possessions. He immediately got them into offensive sets that produced shots.
- Last night’s offense was a version of “Everyone Eats.” No one took more than 15 shots. Sarr led the team with 17 possessions used. Six players used at least 10 possessions, and a seventh (Carrington) used 9. They had 24 assists on 36 made field goals.
- The biggest negative of the night was Kyle Kuzma. The best thing about his night was that he limited himself to just 10 field goal attempts in 30 minutes of action. He contributed almost nothing else — one rebound and one assist for the 6-9 forward. And he had three turnovers and three fouls. His offensive rating for the night: 74. League average: 113.3.
A quick note for those who might note that Kuzma shot 5-10 from the floor and think he wasn’t bad: 50% shooting is subpar. The league average effective field goal percentage entering last night’s game was 53.8%. In the game, the Pacers shot 54.7%; the Wizards shot 52.5%.
No layer in three turnovers, no offensive rebounds, and just one assist, and you have the makings for a poor offensive night. Last night, Kuzma used 11 possessions to produce 8.1 points. The league on average would have produced 12.4 given the same number of possessions.
More specifically, Kuzma’s teammates used 85 possessions to produce 95 points. That’s an offensive rating of 112. Still not good enough to win the game (Indiana’s offensive rating was 120), but it’s an illustration of the impact of one player’s inefficiency.
Four Factors
Below are the four factors that decide wins and losses in basketball — shooting (efg), rebounding (offensive rebounds), ball handling (turnovers), fouling (free throws made).
Stats & Metrics
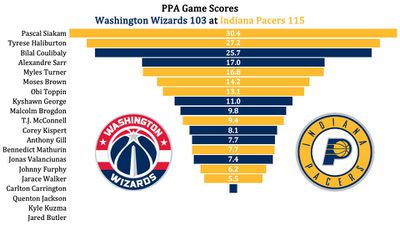
Below are a few performance metrics, including the Player Production Average (PPA) Game Score. PPA is my overall production metric, which credits players for things they do that help a team win (scoring, rebounding, playmaking, defending) and dings them for things that hurt (missed shots, turnovers, bad defense, fouls).
Game Score (GmSC) converts individual production into points on the scoreboard. The scale is the same as points and reflects each player’s total contributions for the game. The lowest possible GmSC is zero.
PPA is a per possession metric designed for larger data sets. In small sample sizes, the numbers can get weird. In PPA, 100 is average, higher is better and replacement level is 45. For a single game, replacement level isn’t much use, and I reiterate the caution about small samples sometimes producing weird results.
POSS is the number of possessions each player was on the floor in this game.
ORTG = offensive rating, which is points produced per individual possessions x 100. League average last season was 114.8. Points produced is not the same as points scored. It includes the value of assists and offensive rebounds, as well as sharing credit when receiving an assist.
USG = offensive usage rate. Average is 20%.
ORTG and USG are versions of stats created by former Wizards assistant coach Dean Oliver and modified by me. ORTG is an efficiency measure that accounts for the value of shooting, offensive rebounds, assists and turnovers. USG includes shooting from the floor and free throw line, offensive rebounds, assists and turnovers.
+PTS = “Plus Points” is a measure of the points gained or lost by each player based on their efficiency in this game compared to league average efficiency on the same number of possessions. A player with an offensive rating (points produced per possession x 100) of 100 who uses 20 possessions would produce 20 points. If the league average efficiency is 114, the league — on average — would produced 22.8 points in the same 20 possessions. So, the player in this hypothetical would have a +PTS score of -2.8.