Stats, analysis, commentary.
The longest winning streak of the Washington Wizards’ 2023-24 season ends at three with last night’s overtime loss to the Brooklyn Nets. C’est la vie.
If you like wildly improbable winning streaks, you were rooting for the Wizards to pull this one out because next up on the schedule is the sad sack Detroit Pistons. And my prediction machine has the Wizards favored against Detroit.
No such luck. Or pas de chance as they say in the land of c’est la vie.
Last night’s game was like the Monday night win against the Chicago Bulls, only more-so. The Nets and Wizards are the 97-pound weaklings of the NBA (well, maybe the Nets are up to 108 or something), and both are effectively eliminated from postseason action, yet they scrapped and battled and competed.
Both teams are deeply flawed. Both had moments of bumbling ineptitude. Both exhibited flawed decision making. Both had key players out with injuries. In other words, it was a close and entertaining game between two bad teams.
The team that shoots better (measured by effective field goal percentage) wins about 80% of the time in the NBA. This was one of the 20%. Washington outshot the Nets 58.2% to 53.1%, but the Brooklyn was +5 on the offensive glass, committed five fewer turnovers, and made 18 free throws to Washington’s 13.
For most of the season, Washington’s offensive struggles were often attributable to the poor efficiency of Jordan Poole and Kyle Kuzma. Last night, they cooked — combining for an offensive rating (points produced per possession x 100) of 134. They got offensive help from Marvin Bagley III (ortg: 166 on 19.1% usage), Deni Avdija (ortg: 119 on 20.9% usage), and kinda-sorta Anthony Gill (he scored five points in 16 minutes, which is heady stuff for him).
Altogether, that quintet used 77 possessions to produce 103 points. That’s an offensive rating of 134, which is terrific. The sextet of Wizards who also played combined to use 28 possessions to produce 16 points. That’s an ortg of 57. Which is horrific.
The primary culprit was Corey Kispert, who routinely draws the amazement of opposing broadcasts for his aggressive shot hunting, as well as the “great shooter” comments whenever he makes a shot. Less often do they mention the lack of other production (last night: two rebounds, zero assists, zero blocks, zero steals, two turnovers, two fouls in 40 minutes), or the fact that he shot just 2-8 from three.
Musings & Observations
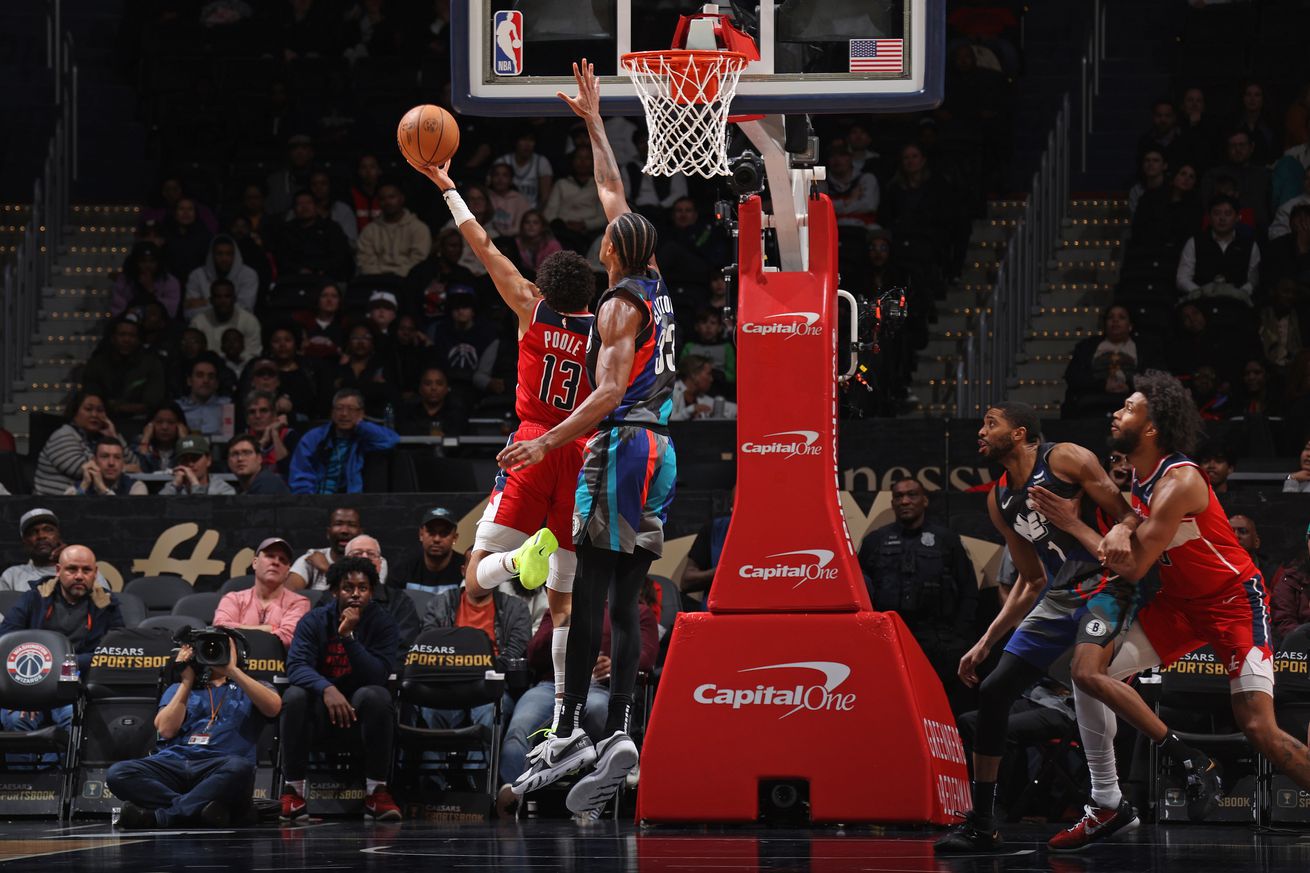
- Poole made shots — 15-24 from the field, 5-12 from three — grabbed seven rebounds and produced eight assists. He also had four turnovers and four fouls. The numbers convey a solidity to his game that wasn’t there when watching. He got hot for a stretch, and he had some very nice passes. His decision making was bad, but it mostly worked out for the night. There’s a reliably productive player in him, IF he would make better decisions, resist the urge for heat check shots, dribbles, and passes, and commit to stuff like getting back on defense and consistently executing the team’s force rules.
- My general impression as I watched was that the Wizards work crazy hard on offense to get bad shots. Sometimes they make them at a decent rate (like last night). But that’s also a reason they’re 25th in offensive efficiency this season. Note: working crazy hard in this case doesn’t necessarily mean they’re working together by employing teamwork. Often the “hard work” comes in the form of mix tape dribbles and dances that don’t go anywhere and ultimately lead to forcing up a contested shot. They look great when they go in, but they generally don’t go in.
- The Wizard are at minimal risk of falling out of the top three in lottery odds. The bottom three teams have the same chances of landing the top pick. Washington currently has the NBA’s second worst record. They’re ahead of the Detroit Pistons, and two games back of the San Antonio Spurs, who are third worst. Washington is four games behind (ahead?) of the Charlotte Hornets, who sit at fourth worst. With just nine games to play, it’s unlikely that Washington can drop out of the bottom three.
Four Factors
Below are the four factors that decide wins and losses in basketball — shooting (efg), rebounding (offensive rebounds), ball handling (turnovers), fouling (free throws made).
Stats & Metrics
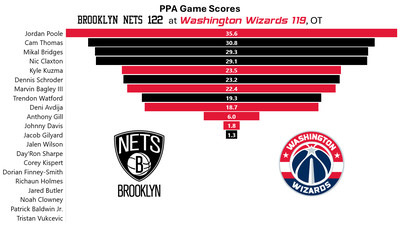
Below are a few performance metrics, including the Player Production Average (PPA) Game Score. PPA is my overall production metric, which credits players for things they do that help a team win (scoring, rebounding, playmaking, defending) and dings them for things that hurt (missed shots, turnovers, bad defense, fouls).
Game Score (GmSC) converts individual production into points on the scoreboard. The scale is the same as points and reflects each player’s total contributions for the game. The lowest possible GmSC is zero.
PPA is a per possession metric designed for larger data sets. In small sample sizes, the numbers can get weird. In PPA, 100 is average, higher is better and replacement level is 45. For a single game, replacement level isn’t much use, and I reiterate the caution about small samples sometimes producing weird results.
POSS is the number of possessions each player was on the floor in this game.
ORTG = offensive rating, which is points produced per individual possessions x 100. League average last season was 114.8. Points produced is not the same as points scored. It includes the value of assists and offensive rebounds, as well as sharing credit when receiving an assist.
USG = offensive usage rate. Average is 20%.
ORTG and USG are versions of stats created by former Wizards assistant coach Dean Oliver and modified by me. ORTG is an efficiency measure that accounts for the value of shooting, offensive rebounds, assists and turnovers. USG includes shooting from the floor and free throw line, offensive rebounds, assists and turnovers.
+PTS = “Plus Points” is a measure of the points gained or lost by each player based on their efficiency in this game compared to league average efficiency on the same number of possessions. A player with an offensive rating (points produced per possession x 100) of 100 who uses 20 possessions would produce 20 points. If the league average efficiency is 114, the league — on average — would produced 22.8 points in the same 20 possessions. So, the player in this hypothetical would have a +PTS score of -2.8.